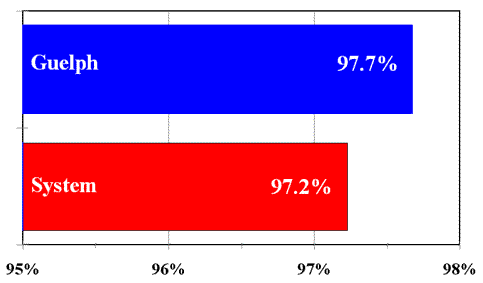
Employment Rates - Guelph Relative to System
Source: 2001 MTCU OSAP Performance Indicators
Two years after graduation

Table 1: Employment Rates - University of Guelph
| Program | Six Months | Two Years |
| Agriculture & Biological Science | 93.1% | 97.8% |
| Architecture/Landscape Architecture | 85.7% | 100.0% |
| Business & Commerce | 97.4% | 100.0% |
| Computer Science 4 | - | - |
| Engineering | 90.5% | 100.0% |
| Fine & Applied Arts | 91.7% | 100.0% |
| Food Sciences & Nutrition | 94.1% | 94.4% |
| Humanities | 95.2% | 95.7% |
| Kinesiology, Recreation & Physical Education 2 | 95.2% | 87.5% |
| Mathematics 4 | - | - |
| Other Arts & Science 3 | 100.0% | 100.0% |
| Physical Science | 92.3% | 91.7% |
| Social Science | 91.8% | 98.5% |
| Veterinary Medicine | 100.0% | 100.0% |
| All Programs | 94.0% | 97.7% |
<< back
Notes:
(1) Employment Rate is measured as the percentage of
1998 graduates of bachelors or first
professional degree programs who were employed 6 months and two years
after graduation.
(2) "Kinesiology" includes students enrolled
in Physical Education, Kinesiology, Recreation
and Education programs in non-teaching fields.
(3) "Other Arts and Science" includes students
enrolled in General Arts and Science majors
not specified by other categories or unspecified.
(4) To maintain adequate confidentiality in compliance
with the Freedom of Information
and Protection of Privacy Act, information has not been shown in instances
where the
number of students is four or less.
Source: 2001 MTCU OSAP Performance Indicators