Emerging and existing animal diseases remain one of the most costly and disruptive threats to Ontario’s agri-food sector—triggering culling, trade restrictions, supply chain shocks and long-term economic damage, which also have implications for farmer mental health and animal welfare.
Until recently, the livestock sector was forced to manage these threats and make decisions about animal health, biosecurity and how to protect herds and flocks with incomplete or lagging information.
Today, that reality is changing.
The Ontario Interactive Animal Pathogen Dashboards (OIAPD) give veterinarians, industry leaders and policymakers near real-time visibility into disease trends, transforming how risks are detected, understood and managed.
The OIAPD, launched in 2020, compile diagnostic testing data from the Animal Health Laboratory (AHL) at the University of Guelph. The dashboards help users track sample submissions, positive cases and percent-positive rates across cattle, poultry, swine and equine populations.
Before the OIAPD, decision‑makers could request monthly summaries of laboratory data, which were accurate but often too fragmented and delayed to inform urgent responses in fast‑moving disease events.
Now, authorized users can access current data within minutes.
Dr. Zvonimir Poljak, a U of G professor in the Department of Population Medicine at the Ontario Veterinary College, created the OIAPD. He says,
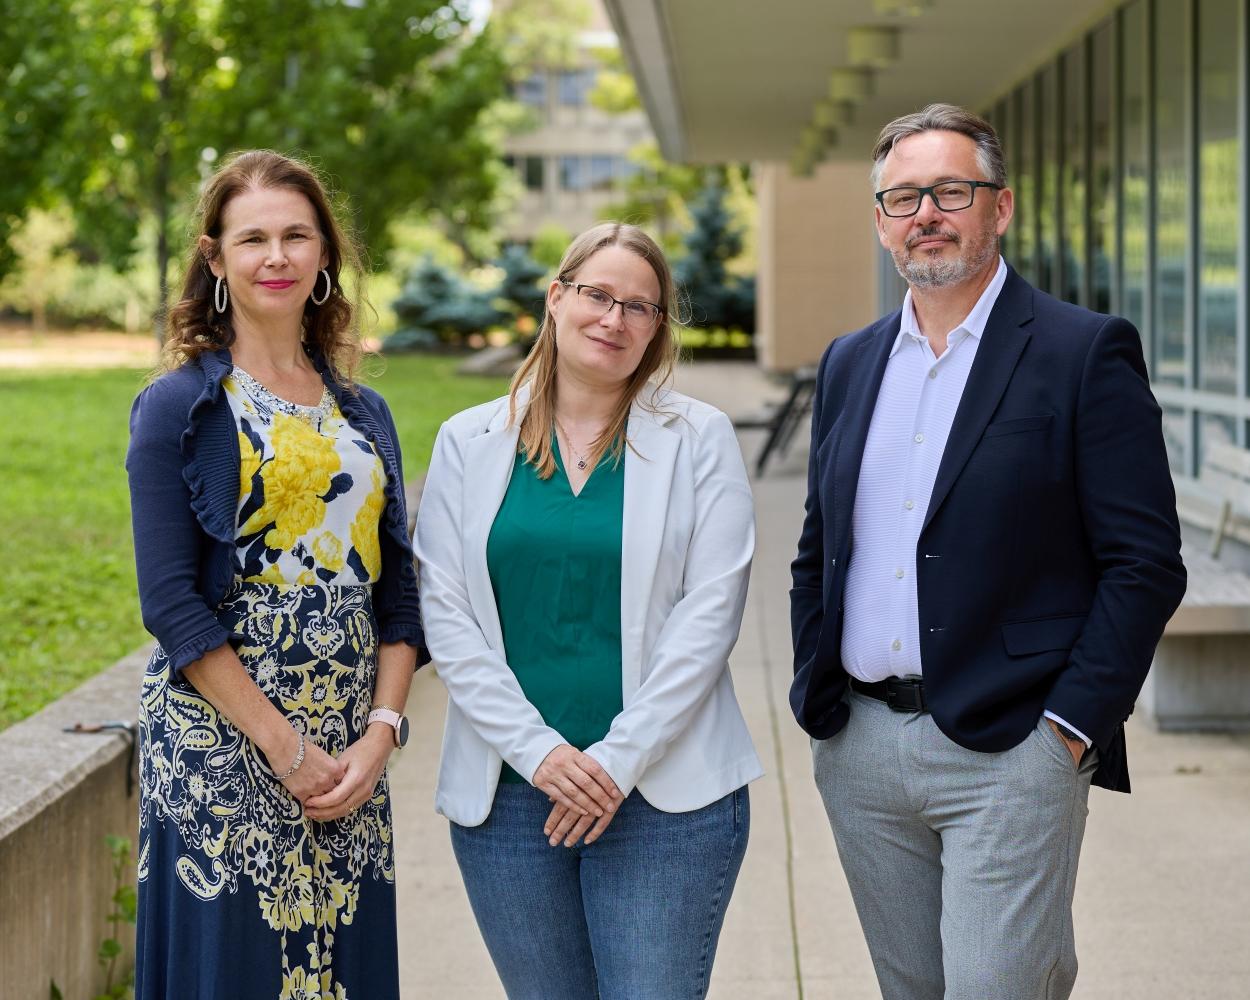
The U of G team: Tatiana Petukhova, Tanya Rossi and Dr. Zvonimir Poljak
We’re taking raw, unstructured data, analyzing it and turning it into actionable information that decision-makers can respond to.
The project’s growth has been supported by a multidisciplinary team, including Research Associate Dr. Tatiana Petukhova, who developed dashboard interfaces and helped translate their findings. As the system has expanded, the dashboards’ data are maintained and managed by Dr. Tanya Rossi, OIAPD project manager and animal health network and data manager at AHL.
“What started as one research project has grown into a province-wide digital surveillance system tracking epidemiological data for four livestock species and dozens of pathogens,” says Rossi. “A system in which tens of thousands of data points are being analyzed in real time.”
Earlier insights, better prevention
Faster access to data is changing how disease risks are managed on the ground across Ontario’s livestock sector.
Dr. Cynthia Miltenburg, lead veterinarian, Animal Health and Welfare (Bovine) at the Ontario Ministry of Agriculture, Food and Agribusiness (OMAFA) and member of the Ontario Animal Health Network (OAHN), uses the dashboards to monitor emerging threats and share insights with producers.
She describes them as powerful knowledge translation tools:
Thanks to the dashboards, we identified Salmonella Dublin emerging as one of the most frequently detected types in cattle. The ability to look at more than 10 years of laboratory data and see how cases have evolved helps us strengthen preparedness at OAHN, and support producers with information they need to reduce the risk of introduction on their farms.
For producers, trend data can translate directly into action.
Charlotte Wall, knowledge translation specialist at the Poultry Industry Council (PIC), explains that access to historical and current data can help the organization determine how infections might originate and whether they’re likely to recur, helping producers take early action and anticipate future risks.
If data suggests infections are coming from outside the barn rather than a parent flock, producers can strengthen biosecurity measures to help mitigate that risk. Similarly, if a disease follows a seasonal pattern year after year, they can prepare for early treatment and reduce losses before they escalate.
Charlotte Wall, Knowledge Translation Specialist, Poultry Industry Council
PIC shares dashboard trend data with producers through events and education, helping them identify where diseases originate and recognize early signs of infection.
“For example, if food or water consumption is decreasing during the same time period that a virus trend is increasing, farmers are more likely to screen for that virus and implement proactive measures to contain the spread,” Wall says.
Veterinarians are also using the dashboards to act sooner.
Dr. Conor Voth, swine veterinarian at Demeter Veterinary Services in Woodstock, Ont., uses them to monitor provincial trends for major swine pathogens, including influenza.
When Voth saw increasing positive cases of a new H1N1 strain, the data confirmed this was not an isolated occurrence, but a broader trend rising across Ontario. He says,
As a veterinarian, if I can see that a particular flu strain is spreading quickly across the province, I’m more likely to test for flu, help ensure our practice is adequately prepared, and be ready to adjust vaccination or medication protocols.
The result is a greater ability to contain outbreaks before they escalate, supported by the dashboards’ early warning.
Faster decisions, better outcomes
Real-time and historical data are also improving decision-making at the system level.
Dr. Luci Rosca, lead veterinarian, Animal Health and Welfare (Poultry) at OMAFA and co-lead at OAHN, uses the dashboards to gather data for the Office of the Chief Veterinarian for Ontario.
Rosca says having immediate access to disease data has been a game changer.
Before the dashboards, information requests were addressed on an ad-hoc basis with a lot of back-and-forth communication between groups, which took significant time," she says. "Now, multiple users can access the same surveillance data in just a few clicks.
This speed can directly influence regulatory and market decisions.
Dr. Ryan Snyder is Canadian poultry key account manager at Ceva Animal Health.
When our company was in the process of bringing a new infectious bronchitis vaccine to market, there was uncertainty around how much of a concern that particular strain was for Ontario," he says. "Working with Dr. Rosca, we obtained data from the dashboards demonstrating its significance as a field challenge, which helped secure market approval, giving producers another option to help manage the disease.
Industry organizations are also using the data to design better risk management tools. Dr. Gbenga Alade is manager of veterinary services at Chicken Farmers of Ontario (CFO). He says,
Having access to reliable data on disease prevalence and frequency is critical when developing risk mitigation tools including insurance programs for farmers. The dashboard helps us better understand risk levels and supports more informed conversations about how those programs could work to help farmers manage disease-related disruption and strengthen the resilience of their operations.
Shared data, coordinated response
With many groups across the livestock sector involved in disease response, a shared evidence base is critical.
The dashboards provide a single, credible source of information across the sector, including farmers, feed and equipment manufacturers, animal health companies, government, marketing boards, auditors and more.
"The dashboards are a centralized source of data that supports consistent, evidence-based decisions", says Wall.
This shared understanding improves coordination and speeds up response time.
Rosca agrees that dashboard data helps clarify risks and foster alignment among industry members.
“When veterinarians were reporting more cases of inclusion body hepatitis (adenovirus), at first it was just trends we were seeing,” says Rosca. “But after looking at data from the past 10 years, we saw that case numbers were consistently going up across the province and the risk became clearer. I was able to share that data with others in the industry and get everyone on the same page before planning next steps.”
This shared understanding supports more efficient, organized approaches to managing—and sometimes identifying—threats.
Miltenburg recalls investigating unexplained increases in spontaneous bovine abortions. Previously, identifying patterns required extensive manual analysis. In this case, OAHN worked with Poljak and the OIAPD team to add a dashboard for abortion cause-tracking in cattle, turning unstructured data into actionable insights that veterinarians and producers can respond to.
“Before the dashboard existed, it took extensive manual analysis to identify an increase in abortions linked to Ureaplasma bacteria,” she says. “That kind of emerging pattern can now be detected in minutes, enabling earlier action to reduce the risk of ongoing losses.”
A more resilient system
As disease risks evolve alongside global trade, climate pressures and production changes, the need for rapid, coordinated action will only grow.
The Ontario Interactive Animal Pathogen Dashboards represent a shift from delayed reporting to live surveillance and early warning. This shift is strengthening animal health and welfare, supporting producer livelihoods and helping maintain market stability.
More broadly, it positions Ontario as a leader in data-driven animal health and surveillance, with a model that could inform similar efforts in other jurisdictions. The dashboards are not just a technical tool; they are a strategic investment in the resilience of Ontario’s agri-food sector.
Alliance investments deliver impact
The Ontario Agri-Food Innovation Alliance, a collaboration between the Government of Ontario and the University of Guelph, supports the development and ongoing advancement of the Ontario Interactive Animal Pathogen Dashboards through the Tier 1 project: Expanding Ontario Interactive Animal Pathogen Dashboards. The project was successfully used to leverage additional funding from other granting agencies, including the Natural Sciences and Engineering Research Council of Canada (NSERC), to further expand this work.
The Alliance also provides financial support for the Animal Health Laboratory at the University of Guelph—the source of dashboard data where disease samples are submitted for diagnostic testing—and the Ontario Animal Health Network (OAHN), which helps fund the bovine abortion and poultry viral subtyping dashboards and supports the infrastructure and expertise behind the surveillance system.
The research that informed the development of these dashboards was supported by Food from Thought at the University of Guelph, which receives research funding in part from the Canada First Research Excellence Fund.
Metrics
40 dashboard licences
Granted to veterinary clinics, animal health academics, regional/provincial/federal governments, public health agencies, industry associations and animal health companies
This website is managed by the University of Guelph. Views expressed here are the views of the University and do not necessarily reflect those of the Government of Ontario.