Rural History at Guelph
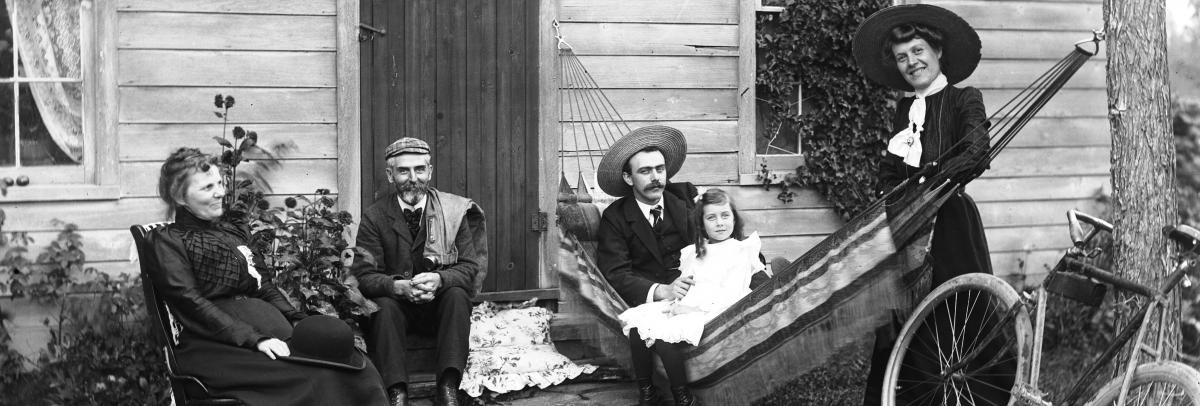
Photograph: Wm and Fannie Forster and family Branchton poss, Stephen Sylvester Main collection, University of Guelph Library, Archives, and Special Collections, Agricultural History (XA1 MS A230 #257)
Research in rural history at the University of Guelph aims to transcend simplified views and distortions about the past. Historians seek to understand rural men and women, families and communities from their viewpoints as they sought to shape themselves and their society. Rural history includes agriculture and non-agricultural rural activities, society, politics, economy, and institutions.
While most people lived in rural settings until the mid-twentieth century, history has been overwhelmingly written from the perspective of urbanites. Often, rural history has been misunderstood as a contrast with the city: if urban is dynamic, rural is static; if urban is progressive, rural is traditional; if urban is bad, rural is good; if urban is artificial, rural is natural.
Since its origins as an agricultural college, the University of Guelph has devoted its attention to studying and serving rural communities. The Department of History shared this interest and was notably recognized in 2002 by the establishment of the Canada Research Chair in Rural History and in 2014 with the creation of the Francis & Ruth Redelmeier Professorship in Rural History. Today, a number of faculty and graduate students pursue research on rural subjects in widely varied contexts.
This website aims to highlight current scholars and their research and provide resources and information related to rural history. In doing so, we hope to encourage more research in the field.