The Research Process
The following pages were created to allow hospitality and tourism managers to familiarize themselves with some of the basic quantitative and qualitative research techniques, concepts and terminology. The objective is to provide this information in an easily accessible format and non-technical language, and link it to references for more in-depth information and other research sites. This undertaking was made possible by the generous support of the Ontario Hostelry Institute, AMEX Canada, and Ryerson University.
The research process involves six distinct phases, although they are not always completely linear, since research is iterative (earlier phases influence later ones, while later ones can influence the earlier phases). Perhaps one of the most important characteristics of a good researcher is the unwillingness to take shortcuts, to rush through the research. It is important to keep an open mind to recognize changes that must be accomodated to ensure the reliability and validity of the research.
1. Problem Definition
Although research reports state the objectives or purpose of the research early on, this is not always the starting point. Often, considerable analysis of historical data or secondary information has been undertaken to help define in very clear and precise terms what is the problem or opportunity. Apparently, Albert Einstein went so far as to say that "the formulation of a problem is often more essential than its solution"! Sometimes, exploratory research is required to help in the formulation of the research problem.
After an introduction which describes the broader context within which the research should be situated, it is important to state the objectives or purpose pursued by the research itself. Often, this is a fairly broad or general statement as well. For instance, in the paper "Not in my backyard: Toronto Resident Attitudes toward Permanent Charity Gaming Clubs", the purpose of the research is given as: "The following study is an attempt to provide a more meaningful and defensible measure of public opinion". This is a fairly vague statement and should have been followed up with a much more precise research question (in question format) or problem statement (a re-wording of the research question into a statement format). For example "What is the attitude of Toronto residents toward permanent charity gaming clubs?"; (research question) or "This study is designed to determine the attitude of Toronto residents toward permanent charity gaming clubs"; (problem statement).
Indeed, the research question could have been broken down further, into subproblems. For instance, "Are there differences in attitude based on age, education and gender?"; or "What are the primary reasons for residents approving or disapproving of permanent charity gaming clubs?"; These subproblems form the nucleus of the research itself and must be directly addressed by the research instrument.
At this point in time it is important to inform the reader about the breadth or scope of the study, in our particular case this includes Toronto residents (the term "Toronto" should probably be defined to ensure a common understanding as to the geographic boundaries) and questions pertaining to permanent casinos and VLTs (but not bingo halls or lotteries, for instance). This scope might be considered to be too broad in nature, and so the researcher can impose limitations or restrictions on the study that make it more doable. As an example, this study was limited to respondents aged 19 or older. Other limitations may have to be imposed on the study due to cost or time constraints or accessibility to respondents. This type of limitation should NOT be confused with methodological limitations, which are addressed as part of the methodology of the study.
All research is based on a set of assumptions or factors that are presumed to be true and valid. For instance, it is generally assumed that respondents will reply honestly and accurately as far as they are able to do so. By stating these assumptions up front, the researcher reduces potential criticism of the research, but without them, the research itself would not be possible. If you thought that respondents would lie, why would you bother doing the research?
In formal research, the researcher will provide an educated guess regarding the outcome of the study, called hypothesis (note that the plural form is hypotheses!). The "educated guess" comes from the related literature. You can also think of hypotheses as the expected answer to the research question and each of the subproblems. The research will test the hypotheses, proving them to be either valid or correct, or invalid/incorrect. Sometimes, researcher will also state that a hypothesis tested positive (valid) or negative (incorrect). It does not matter whether you correctly predict the outcome of the research or not, since rejecting a hypothesis does not mean that the research itself is poor, but rather that your research has results that are different from what the related literature led you to believe should have been expected.
In the case of industry research, once the manager has defined the problem for which s/he needs a solution, and has determined that the information required cannot be obtained using internal resources, an outside supplier will likely be contracted based on a Request for Proposal.
The Request for Proposal (RFP)
The request for proposal (RFP) is part of a formal process of competitively tendering and hiring a research supplier. If the process is undertaken by a public sector organization or large corporation, the process can be extremely strict with set rules regarding communication between client and potential suppliers, the exact time when the proposal must be submitted, the number of copies to be provided, etc. Proposals that required thousands of hours of preparation have been refused for being one minute late (see this article)!
The RFP usually sets out the objectives or client’s information requirements and requests that the proposal submitted by the potential supplier include:
- A detailed research methodology with justification for the approach or approaches proposed;
- Phasing or realistic timelines for carrying out the research;
- A detailed quotation by phase or task as well as per diem rates and time spent for each researcher participating in the execution of the work;
- The qualifications of each participating researcher and a summary of other projects each person has been involved in to demonstrate past experience and expertise
The client should provide the potential suppliers with the criteria for selection and the relative weight assigned to each one, to assist suppliers in understanding where trade-offs might need to be made between available budget and importance. These criteria also allow the supplier to ensure that all areas deemed important by the client have been addressed as part of the proposal.
At times, clients ask a short-listed number of suppliers to present their proposed methodology during an interview, which allows for probing by the client but also discussion as to the advantages and disadvantages associated with the research design that is proposed.
2. Literature Review
Knowledge is cumulative: every piece of research will contribute another piece to it. That is why it is important to commence all research with a review of the related literature or research, and to determine whether any data sources exist already that can be brought to bear on the problem at hand. This is also referred to as secondary research. Just as each study relies on earlier work, it will provide a basis for future work by other researchers.
The literature review should provide the reader with an explanation of the theoretical rationale of the problem being studied as well as what research has already been done and how the findings relate to the problem at hand. In the paper "Not in my backyard: Toronto Resident Attitudes toward Permanent Charity Gaming Clubs", Classen presented the context of the current gaming situation, the Canadian and local gaming scene including theories as the acceptance of gaming and its future, as well as studies regarding the economic and social issues relating to gaming and how these affect residents’ opinions. It is most helpful to divide the literature into sub-topics for ease of reading.
The quality of the literature being reviewed must be carefully assessed. Not all published information is the result of good research design, or can be substantiated. Indeed, a critical assessment as to the appropriateness of the methodology employed can be part of the literature review, as Classen did with the Bradgate Study on Public Opinion.
This type of secondary research is also extremely helpful in exploratory research. It is an economical and often easily accessible source of background information that can shed light on the real scope of the problem or help familiarize the researcher with the situation and the concepts that require further study.
3. Selection of Research Design, Subjects and Data Collection Techniques
Once the problem has been carefully defined, the researcher needs to establish the plan that will outline the investigation to be carried out. The research design indicates the steps that will be taken and in what sequence they occur.
There are two main types of research design:
- Exploratory research
- Conclusive research itself subdivided into
Each of these types of research design can rely on one or more data collection techniques:
- Observation technique
- Direct communication with subjects, e.g. survey technique, interview or projective methods
- Secondary research, which essentially means reviewing literature and data sources, collected for some other purpose than the study at hand.
Irrespective of the data collection technique used, it is critical that the researcher analyze it for its validity and reliability.
Another critical consideration in determining a study’s methodology is selection of subjects. If the researcher decides to study all elements within a population, s/he is in fact conducting a census. Although this may be ideal, it may not be very practical and can be far too costly. The alternative is to select a sample from the population. If chosen correctly, it is considered to be representative of the population. In this case, we are dealing with one of the probability sampling techniques. If the sample is not representative, then one of the non-probability sampling techniques was employed.
When research is written up as a part of a newspaper article, there should always be an indication as to the methodology employed, as is the case with the attached article.
Exploratory Research
As the term suggests, exploratory research is often conducted because a problem has not been clearly defined as yet, or its real scope is as yet unclear. It allows the researcher to familiarize him/herself with the problem or concept to be studied, and perhaps generate hypotheses to be tested. It is the initial research, before more conclusive research is undertaken. Exploratory research helps determine the best research design, data collection method and selection of subjects, and sometimes it even concludes that the problem does not exist!
Another common reason for conducting exploratory research is to test concepts before they are put in the marketplace, always a very costly endeavour. In concept testing, consumers are provided either with a written concept or a prototype for a new, revised or repositioned product, service or strategy.
Exploratory research can be quite informal, relying on secondary research such as reviewing available literature and/or data, or qualitative approaches such as informal discussions with consumers, employees, management or competitors, and more formal approaches through in-depth interviews, focus groups, projective methods, case studies or pilot studies.
The results of exploratory research are not usually useful for decision-making by themselves, but they can provide significant insight into a given situation. Although the results of qualitative research can give some indication as to the "why", "how" and "when" something occurs, it cannot tell us "how often" or "how many". In other words, the results can neither be generalized; they are not representative of the whole population being studied.
Conclusive Research
As the term suggests, conclusive research is meant to provide information that is useful in reaching conclusions or decision-making. It tends to be quantitative in nature, that is to say in the form of numbers that can be quantified and summarized. It relies on both secondary data, particularly existing databases that are reanalyzed to shed light on a different problem than the original one for which they were constituted, and primary research, or data specifically gathered for the current study.
The purpose of conclusive research is to provide a reliable or representative picture of the population through the use of a valid research instrument. In the case of formal research, it will also test hypothesis.
Conclusive research can be sub-divided into two major categories:
Descriptive Research
Descriptive research or statistical research provides data about the population or universe being studied. But it can only describe the "who, what, when, where and how" of a situation, not what caused it. Therefore, descriptive research is used when the objective is to provide a systematic description that is as factual and accurate as possible. It provides the number of times something occurs, or frequency, lends itself to statistical calculations such as determining the average number of occurences or central tendencies.
One of its major limitations is that it cannot help determine what causes a specific behaviour, motivation or occurrence. In other words, it cannot establish a causal research relationship between variables.
The two most commonly types of descriptive research designs are
- Observation and
- Surveys
Causal Research
If the objective is to determine which variable might be causing a certain behaviour, i.e. whether there is a cause and effect relationship between variables, causal research must be undertaken. In order to determine causality, it is important to hold the variable that is assumed to cause the change in the other variable(s) constant and then measure the changes in the other variable(s). This type of research is very complex and the researcher can never be completely certain that there are not other factors influencing the causal relationship, especially when dealing with people’s attitudes and motivations. There are often much deeper psychological considerations, that even the respondent may not be aware of.
There are two research methods for exploring the cause and effect relationship between variables:
Primary Research
In primary research, data is collected specifically for the study at hand. It can be obtained either by the investigator observing the subject or phenomenon being studied, or communicating directly or indirectly with the subject. Direct communication techniques include such qualitative research techniques as in-depth interview, focus group and projective techniques, and quantitative research techniques such as telephone, self-administered and interview surveys.
Observation
Observation is a primary method of collecting data by human, mechanical, electrical or electronic means. The researcher may or may not have direct contact or communication with the people whose behaviour is being recorded. Observation techniques can be part of qualitative research as well as quantitative research techniques. There are six different ways of classifying observation methods:
- participant and nonparticipant observation, depending on whether the researcher chooses to be part of the situation s/he is studying (e.g. studying social interaction of tour groups by being a tour participant would be participant observation)
- obtrusive and unobtrusive (or physical trace) observation, depending on whether the subjects being studied can detect the observation (e.g. hidden microphones or cameras observing behaviour and doing garbage audits to determine consumption are examples of unobtrusive observation)
- observation in natural or contrived settings, whereby the behaviour is observed (usually unobtrusively) when and where it is occurring, while in the contrived setting the situation is recreated to speed up the behaviour
- disguised and non-disguised observation, depending on whether the subjects being observed are aware that they are being studied or not. In disguised observation, the researcher may pretend to be someone else, e.g. "just" another tourist participating in the tour group, as opposed to the other tour group members being aware that s/he is a researcher.
- Structured and unstructured observation, which refers to guidelines or a checklist being used for the aspects of the behaviour that are to be recorded; for instance, noting who starts the introductory conversation between two tour group members and what specific words are used by way of introduction.
- Direct and indirect observation, depending on whether the behaviour is being observed as it occurs or after the fact, as in the case of TV viewing, for instance, where choice of program and channel flicking can all be recorded for later analysis.
The data being collected can concern an event or other occurrence rather than people. Although usually thought of as the observation of nonverbal behaviour, this is not necessarily true since comments and/or the exchange between people can also be recorded and would be considered part of this technique, as long as the investigator does not control or in some way manipulate what is being said. For instance, staging a typical sales encounter and recording the responses and reactions by the salesperson would qualify as observation technique.
One distinct advantage of the observation technique is that it records actual behaviour, not what people say they said/did or believe they will say/do. Indeed, sometimes their actual recorded behaviour can be compared to their statements, to check for the validity of their responses. Especially when dealing with behaviour that might be subject to certain social pressure (for example, people deem themselves to be tolerant when their actual behaviour may be much less so) or conditioned responses (for example, people say they value nutrition, but will pick foods they know to be fatty or sweet), the observation technique can provide greater insights than an actual survey technique.
On the other hand, the observation technique does not provide us with any insights into what the person may be thinking or what might motivate a given behaviour/comment. This type of information can only be obtained by asking people directly or indirectly.
When people are being observed, whether they are aware of it or not, ethical issues arise that must be considered by the researcher. Particularly with advances in technology, cameras and microphones have made it possible to gather a significant amount of information about verbal and non-verbal behaviour of customers as well as employees that might easily be considered to be an invasion of privacy or abusive, particularly if the subject is unaware of being observed, yet the information is used to make decisions that impact him/her.
Direct Communication
There are many different ways for the investigator to collect data from subjects by communicating directly with them either in person, through others or through a document, such as a questionnaire. Direct communication is used in both qualitative and quantitative research. Each has a number of different techniques:
1. Qualitative research techniques
2. Quantitative research techniques
Qualitative Research Techniques
Although qualitative research can be used as part of formal or conclusive research, it is most commonly encountered when conducting exploratory research. Qualitative research techniques are part of primary research.
Qualitative research differs from quantitative research in the following ways:
- The data is usually gathered using less structured research instruments
- The findings are more in-depth since they make greater use of open-ended questions
- The results provide much more detail on behaviour, attitudes and motivation
- The research is more intensive and more flexible, allowing the researcher to probe since s/he has greater latitude to do so
- The results are based on smaller sample sizes and are often not representative of the population,
- The research can usually not be replicated or repeated, given it low reliability; and
- The analysis of the results is much more subjective.
Because of the nature of the interaction with respondents, the training and level of expertise required by the person engaging in the direct communication with the respondents must be quite high.
The most common qualitative research techniques include:
- In-depth interview
- Focus group
- Projective methods
- Case study
- Pilot study
The Experience Survey
Any time a researcher or decision-maker needs to gain greater insight into a particular problem, he or she is likely to question knowledgeable individuals about it. This is usually done through an informal, free-flowing conversation with anyone who is believed to be able to shed light on the question both within the organization and outside it. Such an approach is referred to as an experience survey. It is only meant to help formulate the problem and clarify concepts, not develop conclusive evidence.
People seen as providing the insight necessary are not only found in the top ranks of an organization or amongst its "professional" staff, but can also involve front line employees. Who else, for instance, is better placed to comment on recurring complaints from guests? In an experience survey, respondents are not selected randomly nor are they representative of the organization or department within which they work. Rather, they are knowledgeable, articulate and thoughtful individuals.
Related Readings (Zikmund, W.G. (1997). Exploring Marketing Research, 6th edition. Orlando: The Dryden Press)
Case Study
When it is deemed desirable to learn from the experience of others, researchers often resort to the case study. In this comprehensive description and analysis of one or a few situations that are similar to the one being studied, the emphasis is on an entire organization with great attention paid to detail in order to understand and document the relationships among circumstances, events, individuals, processes, and decisions made.
In order to obtain the information required, it is usually necessary to conduct a depth interview with key individuals in the organization as well as consulting internal documents and records or searching press reports. Observation of actual meetings, sales calls or trips, negotiations, etc. can also prove insightful, since "actions speak louder than words", even when it comes to understanding how decisions are made in an organization or why some organizations are more successful than others.
However, caution must be exercised in transferring lessons to other situations: there is no "formula" that can be applied, but rather a context that must be understood and interaction among individuals that must be appreciated. Individual personalities, their vision and drive contribute as much if not more to the success of an organization than processes.
Related Readings (link to Library. Kumar, V., Aaker, D.A. & Day, G.S. (1999). Essentials of Marketing Research. New York: John Wiley & Sons, Inc.)
Pilot Study
When data is collected from a limited number of subjects selected from the population targetted by the research project, we refer to it as a pilot study. A pilot study can also take the form of a trial run. For instance, an advertising campaign is tested in a specific market before it goes nation-wide, to study the response by potential consumers.
In a pilot study, the rigorous standards used to obtain precise, quantitative estimates from large, representative samples are often relaxed, since the objective is to gain insight into how subjects will respond prior to administering the full survey instrument. Although a pilot study constitutes primary research, it tends to be used in the context of a qualitative analysis.
There are four major qualitative research techniques that can be used as part of a pilot study. These are
- Depth interview
- Focus group (or group depth interview)
- Panel
- Projective technique
Related Readings (Kumar, V., Aaker, D.A. & Day, G.S. (1999). Essentials of Marketing Research. New York: John Wiley & Sons, Inc.)
In-Depth Interview
When it is important to explore a subject in detail or probe for latent attitudes and feelings, the in-depth interview may be the appropriate technique to use. Depth interviews are usually conducted in person, although telephone depth interviewing is slowly gaining greater acceptance.
With the approval of the respondent, the interview is audio taped, and may even be video-taped, in order to facilitate record keeping. Although it is a good idea to prepare an interview guide ahead of time to be sure to cover all aspects of the topic, the interviewer has significant freedom to encourage the interview to elaborate or explain answers. It is even possible to digress from the topic outline, if it is thought to be fruitful.
Interviewers must be very experienced or skilled, since it is critical that s/he and the respondent establish some kind of rapport, and that s/he can adapt quickly to the personality and mood of the person being interviewed. This will elicit more truthful answers. In order to receive full cooperation from the respondent, the interviewer must be knowledgeable about the topic, and able to relate to the respondent on his/her own terms, using the vocabulary normally used within the sector being studied. But the interviewer must also know when it is necessary to probe deeper, get the interviewee to elaborate, or broaden the topic of discussion.
Since an interview can last anywhere from 20 to 120 minutes, it is possible to obtain a very detailed picture about the issues being researched. Even without considering the potential from interviewer bias, analyzing the information obtained requires great skill and may be quite subjective. Quantifying and extrapolating the information may also prove to be difficult.
Related Readings (Kumar, V., Aaker, D.A. & Day, G.S. (1999). Essentials of Marketing Research. New York: John Wiley & Sons, Inc.; Zikmund, W.G. (1997). Exploring Marketing Research, 6th edition. Orlando: The Dryden Press)
Focus Group
In the applied social sciences, focus group discussions or group depth interviews are among the most widely used research tool. A focus group takes advantage of the interaction between a small group of people. Participants will respond to and build on what others in the group have said. It is believed that this synergistic approach generates more insightful information, and encourages discussion participants to give more candid answers. Focus groups are further characterized by the presence of a moderator and the use of a discussion guide. The moderator should stimulate discussion among group members rather than interview individual members, that is to say every participant should be encouraged to express his/her views on each topic as well as respond to the views expressed by the other participants. In order to put focus group participants at ease, the moderator will often start out by assuring everyone that there are no right or wrong answers, and that his/her feelings cannot be hurt by any views that are expressed since s/he does not work for the organization for whom the research is being conducted.
Although the moderator's role is relatively passive, it is critical in keeping the discussion relevant. Some participants will try to dominate the discussion or talk about aspects that are of little interest to the research at hand. The type of data that needs to be obtained from the participants will determine the extent to which the session needs to be structured and therefore just how directive the moderator must be.
Although focus group sessions can be held in many different settings, and have been known to be conducted via conference call, they are most often conducted in special facilities that permit audio recording and/or video taping, and are equipped with a one-way mirror. This observation of research process as it happens can be invaluable when trying to interpret the results. The many disparate views that are expressed in the course of the 1 to 2 hour discussion make it at times difficult to capture all observations on each topic. Rather than simply summarizing comments, possible avenues for further research or hypotheses for testing should be brought out.
Focus groups are normally made up of anywhere between 6 and 12 people with common characteristics. These must be in relation to what is being studied, and can consist of demographic characteristics as well as a certain knowledge base or familiarity with a given topic. For instance, when studying perceptions about a certain destination, it may be important to have a group that has visited it before, while another group would be composed of non-visitors. It must, however, be recognized that focus group discussions will only attract a certain type of participant, for the most part extroverts. (Read the set-up for a focus group on the perception and image of a destination in Southwestern Ontario.)
It is common practice to provide a monetary incentive to focus group participants. Depending on the length of the discussion and the socio-demographic characteristics of the participants being recruited, this can range anywhere from $30 to $100 per hour and more for professionals or other high income categories. Usually several focus groups are required to provide the complete diversity of views, and thus this is a fairly expensive option among the research techniques.
This incentive makes it easier to recruit participants, but can also lead to professional respondents. These are people who participate in too many focus groups, and thus learn to anticipate the flow of the discussion. Some researchers believe that these types of respondents no longer represent the population. See the following letter "Vision is blurred..." and response "Focus groups gain key insights..." that appeared in the Toronto Star, for instance.
For further information on focus groups, check out Smartpoint Research Focus Group and also see their links for additional background. You can even sign up to participate in a focus group yourself!
Related Readings (Stewart, D.W. & Shamdasani, P.N. (1990), Focus Groups: Theorgy and Practice. Newbury Park: Sage Publications; Kumar, V., Aaker, D.A. & Day, G.S. (1999). Essentials of Marketing Research. New York: John Wiley & Sons, Inc.; Zikmund, W.G. (1997). Exploring Marketing Research, 6th edition. Orlando: The Dryden Press)
THE TORONTO STAR Saturday, August 14, 1999 A27
THE TORONTO STAR Saturday, August 14, 1999 A27
Focus groups gain key insights into needs
Re Vision is blurred (Opinion page Aug. 5).
The opinion piece about focus group participation written by Michael Dojc contains many blanket statements based on supposition, with little to link it to quantifiable facts.
Dojc seems to attribute an apathy and incompetence to the recruiters who so willingly (in his view) allow a self-admitted liar such as himself to gain admittance to these groups.
He also seems to think that the recruiting industry is somehow at fault for not finding him out.
As is the case with many activities within this 3ociety, market researchers
have to rely to some degree on the inherent honesty and goodwill of everyday people.
Focus groups provide a unique and Important medium for marketers to gain key insights into target consumers attitudes, needs and wants in a dialogue that allows for in-depth probing.
And, in my observation, not only do Many focus group participants enjoy the opportunity to provide legitimate feedback about a product or service, most understand that their reactions, thoughts, and feelings may have a substantive impact on marketing activities, and as such they do not actively misrepresent themselves.
Of course, there are always a few "bad apples" out to milk the system for whatever they can get.
To weed out these people, Central Files, a centralized database of focus group participants, exists to maintain control over the frequency of respondent attendance, and to exclude undesirable respondents (defined as those who have been determined to have lied during screening, been overly disruptive during a group session, or those classified as professional respondents because they have attended many more groups than normal as a way to make extra money).
The ability of the system to function
effectively is directly related to the number of firms who participate.
The Professional Marketing Research Society, of which I am a member, strongly endorses that all researchers buy recruiting services from those firms who submit names to Central Files, to minimize the chance that fake respondents such as Dojc slip through.
Dojc's description of his interaction with focus group recruiters serves more to reveal his own moral inadequacies (Lying and cheating to make a few bucks) than to expose systemic problems in the research recruitment sector.
CAMILLA LEONARD
THE TORONTO STAR Saturday, August 5, 1999 A21
|
THE TORONTO STAR Saturday, August 5, 1999 A21 |
|||
|
Vision is blurred at many focus groups |
|||
|
BY MICHAEL DOJC Many market, research groups are experiencing tunnel vision when it experiencing tunnel vision when it comes to focus group testing. By dipping and double dipping and triple dipping into the same pool of people again and again, focus groups are really working with a fuzzy lens. I started attending focus groups when I was 16 years old and I always relished the experience of not only trying out a new product, but being paid for it as well. Though it didn't take long for me to rush through the surveys, get my cash and run. Since then, I have been repeatedly called, approximately twice a month, by the various groups in the Toronto area and even more times since I turned 19. But now the novelty has worn off and I am beginning to realize the sheer inconsequence of the groups. I am not the only disenchanted frequent focus group attendee at these gatherings. It did not take long to notice that it is the same people who go every time. We all know the drill so well that we are never refused entry by the faceless telephone operators who screen candidates. |
I came up with this simple formula that has never failed me yet. The first thing you have to realize is that the person on the other end of the phone does not care about you, and while they may not believe everything you say, they will diligently write it down as if it were the gospel. The following is an example of the typical screening process: "Hi, this is Casey from X recruiting, would you be interested in participating in a focus group? It pays $30 for 45 minutes." The answer to this question is an assured "yes" or "sure," depending on your personal preference both will do quite fine. "First we have to see if you qualify. Have you done a focus group in the last three months?" The answer is "no." Even if you have attended one, they will never check their records and even if the same person called you the last time, it is highly unlikely they will remember, considering that they make hundreds of calls every day. "Do you or any of your immediate family members work in advertising, television, journalism or media?" |
Again the answer is "no" and the same aforementioned rules apply. "Which of the following have you purchased in the last week?" The answer to any question of this type is always an affirmative "yes." Never take a chance. The one negative you give could be the qualifying question. It has happened to me-on numerous occasions and they never let you take it back. "Actually I did buy a bottle of wine this week, .1 just remembered," I coyly added after being rejected. I was not even given the courtesy of a response as the dial tone rang in my ear. Do not be concerned that the phone operator will find you strange for haying purchased every item they list off. -They really couldn't care less. On many occasions they will ask you if you have any friends who would be interested in coming out. Always give them as many names as you can. It never hurts to be nice to people and who knows, maybe your friends will return the favour. One of my friends invented a fictional twin brother and requalified under the inventive alias for the same focus group just one hour later than the one he had signed up for under his |
own name. After finishing the first group, my friend went to the bathroom, put on a backwards Yankees cap, and went right back in. Once you get in, the rest is child's play. The focus group supervisors will explain everything they want you to do in baby speak and they may even do it twice to make sure you understand that you should write your assigned number in the top left-hand corner of the survey sheet beside the word marked "number." It's become almost a social event for my friends and I who now go in-groups and make bets as to who will get out first. We take pleasure in writing down funny answers to the stupid questions that are invariably asked, like, how an image of a certain beverage makes you feel. It's truly amazing that companies are throwing around millions of dollars in these so-called research ventures, where they inter view professional focus group attendees who couldn't care less about the product a company is hawking, even if it's one they use on a regular basis. Michael Dojc is a student at McMaster University and an Intern at the Town Crier in Toronto.
|
Panels
When it is important to collect information on trends, whether with respect to consumer preferences and purchasing behaviour or changes in business climate and opportunities, researchers may decide to set up a panel of individuals which can be questioned or surveyed over an extended period of time.
There are essentially three different types of panels:
The most common uses for panels are
- Trend monitoring and future assessment,
- Test marketing and impact assessment, and
- Priority setting for planning and development.
There are some clear advantages to using panels. These include the fact that recall problems are usually minimized, and that it is even possible to study the attitudes and motivation of non-respondents. However, it must also be recognized that maintaining panels is a constant effort. Since there is a tendency for certain people to drop out (those that are too busy, professionals, senior executives, etc.), this can lead to serious bias in the type of respondent that remains on the panel. Participants can also become too sensitized to the study objectives, and thus anticipate the responses they " should" be giving.
Related Readings (LaPage, W.F. (1994). "Using Panels for Travel and Tourism Research", Ch. 40 in Ritchie and Goeldner; Zikmund, W.G. (1997). Exploring Marketing Research, 6th edition. Orlando: The Dryden Press)
Consumer Panels
When researchers are interested in detailed information about purchasing behaviour or insight into certain leisure activities, they will often resort to panels of consumers. A panel will allow the researcher to track behaviour using the same sample over time. This type of longitudinal research provides more reliable results on changes that occur as a result of life cycle, social or professional status, attitudes and opinions. By working with the same panel members, intentions can be checked against action, one of the more problematic challenges that researchers face when studying planned purchases or intentions to engage in certain behaviour (e.g. going on trips, visiting certain sites, participating in sports, etc.).
But looking at trends is not the only use for panels. They can also provide invaluable insight into product acceptance prior to the launch of a new product or service, or a change in packaging, for instance. Panels, whether formally established or tracked informally through common behaviour (e.g. membership in a club, purchase of a specific product, use of a fidelity card, etc.), can also be used to study the reaction to potential or actual events, the use of promotional materials, or the search for information.
Compared to the depth interview and the focus group, a panel is less likely to exaggerate the frequency of a behaviour or purchase decision, or their brand loyalty. Although panels only require sampling once, maintaining the panel can be both time-consuming and relatively costly as attrition and hence finding replacements can be quite high. In order to allow researchers to obtain more detailed follow-up information from panel members, they are usually paid for their services. At the same time, this can introduce a bias into the panel, since the financial incentive will be more or less important depending on the panelists economic status.
Possibly one of the more interesting advantages of panels is that they can provide significant insight into non-response as well as non-participation or decisions not to purchase a given product.
Related Readings (link to Library. Lapage, W.F., Ch. 40 in Ritchie and Goeldner; Kumar, V., Aaker, D.A. & Day, G.S. (1999). Essentials of Marketing Research. New York: John Wiley & Sons, Inc.)
The Nominal Group Technique
Originally developed as an organizational planning technique by Delbecq, Van de Ven and Gustafson in 1971, the nominal group technique is a consensus planning tool that helps prioritize issues.
In the nominal group technique, participants are brought together for a discussion session led by a moderator. After the topic has been presented to session participants and they have had an opportunity to ask questions or briefly discuss the scope of the topic, they are asked to take a few minutes to think about and write down their responses. The session moderator will then ask each participant to read, and elaborate on, one of their responses. These are noted on a flipchart. Once everyone has given a response, participants will be asked for a second or third response, until all of their answers have been noted on flipcharts sheets posted around the room.
Once duplications are eliminated, each response is assigned a letter or number. Session participants are then asked to choose up to 10 responses that they feel are the most important and rank them according to their relative importance. These rankings are collected from all participants, and aggregated. For example:
Overall measure
| Response | Participant 1 | Participant 2 | Participant 3 | Importance |
|---|---|---|---|---|
| A | ranked 1st | ranked 2nd | ranked 2nd | 5 = ranked 1st |
| B | ranked 3rd | ranked 1st | ranked 3rd | 7 = ranked 3rd |
| C | ranked 2nd | ranked 3rd | ranked 1st | 6 = ranked 2nd |
| D | ranked 4th | ranked 4th | ranked 4th | 12 = ranked 4th |
Sometimes these results are given back to the participants in order to stimulate further discussion, and perhaps a readjustment in the overall rankings assigned to the various responses. This is done only when group consensus regarding the prioritization of issues is important to the overall research or planning project.
The nominal group technique can be used as an alternative to both the focus group and the Delphi techniques. It presents more structure than the focus group, but still takes advantage of the synergy created by group participants. As its name suggests, the nominal group technique is only "nominally" a group, since the rankings are provided on an individual basis.
Related Readings (Ritchie, J.R.B., E.L., Ch. 42 in Ritchie and Goeldner)
Delphi Technique
Originally developed by the RAND Corporation in 1969 for technological forecasting, the Delphi Method is a group decision process about the likelihood that certain events will occur. Today it is also used for environmental, marketing and sales forecasting.
The Delphi Method makes use of a panel of experts, selected based on the areas of expertise required. The notion is that well-informed individuals, calling on their insights and experience, are better equipped to predict the future than theoretical approaches or extrapolation of trends. Their responses to a series of questionnaires are anonymous, and they are provided with a summary of opinions before answering the next questionnaire. It is believed that the group will converge toward the "best" response through this consensus process. The midpoint of responses is statistically categorized by the median score. In each succeeding round of questionnaires, the range of responses by the panelists will presumably decrease and the median will move toward what is deemed to be the "correct" answer.
One distinct advantage of the Delphi Method is that the experts never need to be brought together physically, and indeed could reside anywhere in the world. The process also does not require complete agreement by all panelists, since the majority opinion is represented by the median. Since the responses are anonymous, the pitfalls of ego, domineering personalities and the "bandwagon or halo effect" in responses are all avoided. On the other hand, keeping panelists for the numerous rounds of questionnaires is at times difficult. Also, and perhaps more troubling, future developments are not always predicted correctly by iterative consensus nor by experts, but at times by "off the wall" thinking or by "non-experts".
Related Readings (link to Library. Moeller, G.H. & Shafer, E.L., Ch. 39 in Ritchie and Goeldner , and Taylor, R.E. & Judd, L.L. (1994). "Delphi Forecasting" in Witt, S.F. & Moutinho, L. Tourism Marketing and Management Handbook. London: Prentice Hall)
Projective Techniques
Deeply held attitudes and motivations are often not verbalized by respondents when questioned directly. Indeed, respondents may not even be aware that they hold these particular attitudes, or may feel that their motivations reflect badly on them. Projective techniques allow respondents to project their subjective or true opinions and beliefs onto other people or even objects. The respondent's real feelings are then inferred from what s/he says about others.
Projective techniques are normally used during individual or small group interviews. They incorporate a number of different research methods. Among the most commonly used are:
- Word association test
- Sentence completion test
- Thematic apperception test (TAT)
- Third-person techniques
While deceptively simple, projective techniques often require the expertise of a trained psychologist to help devise the tests and interpret them correctly.
Related Readings (Kumar, V., Aaker, D.A. & Day, G.S. (1999). Essentials of Marketing Research. New York: John Wiley & Sons, Inc.; Rotenberg, R.H. (1995). A Manager's Guide to Marketing Research, Toronto: Dryden; Zikmund, W.G. (1997). Exploring Marketing Research, 6th edition. Orlando: The Dryden Press)
Word Association Test
There are a number of ways of using word association tests:
- A list of words or phrases can be presented in random order to respondents, who are requested to state or write the word or phrase that pops into their mind;
- Respondents are asked for what word or phrase comes to mind immediately upon hearing certain brand names;
- Similarly, respondents can be asked about slogans and what they suggest;
- Respondents are asked to describe an inanimate object or product by giving it "human characteristics" or associating descriptive adjectives with it.
For example, a group of tourism professionals working on establishing a strategic marketing plan for their community were asked to come up with personality traits or "human characteristics" for the villages as well as the cities within their area:
Villages
- Serene
- Conservative
- Quaint
- Friendly
- Accessible
- Reliable
Cities
- Brash
- Rushed
- Liberal
- Modern
- Cold
Most of the tourism industry representatives came from the cities and had strongly argued that the urban areas had historically been neglected in promotional campaigns. As a result of this and other exercises, they came to the realization that the rural areas were a strong feature of the overall attractiveness of the destination and needed to be featured as key elements in any marketing campaign.
Related Readings (Kumar, V., Aaker, D.A. & Day, G.S. (1999). Essentials of Marketing Research. New York: John Wiley & Sons, Inc.; Rotenberg, R.H. (1995). A Manager's Guide to Marketing Research, Toronto: Dryden; Zikmund, W.G. (1997). Exploring Marketing Research, 6th edition. Orlando: The Dryden Press)
Sentence Completion
In the sentence completion method, respondents are given incomplete sentences and asked to complete the thought. These sentences are usually in the third person and tend to be somewhat ambiguous. For example, the following sentences would provide striking differences in how they were completed depending on the personality of the respondent:
"A beach vacation is..."
"Taking a holiday in the mountains is..."
"Golfing is for..."
"The average person considers skiing..."
"People who visit museums are..."
Generally speaking, sentence completion tests are easier to interpret since the answers provided will be more detailed than in a word association test. However, their intent is also more obvious to the respondent, and could possible result in less honest replies.
A variant of this method is the story completion test. A story in words or pictures is given to the respondent who is then asked to complete it in his/her own words.
Related Readings (Kumar, V., Aaker, D.A. & Day, G.S. (1999). Essentials of Marketing Research. New York: John Wiley & Sons, Inc.; Rotenberg, R.H. (1995). A Manager's Guide to Marketing Research, Toronto: Dryden; Zikmund, W.G. (1997). Exploring Marketing Research, 6th edition. Orlando: The Dryden Press)
Thematic Apperception
In the Thematic Apperception Test (TAT), the respondents are shown one or more pictures and asked to describe what is happening, what dialogue might be carried on between characters and/or how the "story" might continue. For this reason, TAT is also known as the picture interpretation technique. (click to view an example)
Although the picture, illustration, drawing or cartoon that is used must be interesting enough to encourage discussion, it should be vague enough not to immediately give away what the project is about.
TAT can be used in a variety of ways, from eliciting qualities associated with different products to perceptions about the kind of people that might use certain products or services.
For instance, respondents were shown a schematic logo (click here) and asked what type of destination would have such a logo, and what a visitor might expect to find. Some of the comments were:
- That makes me think of the garden.
- It is the city in the country, very much so.
- It looks like New York, with the Empire State Building right there.
- Calming, relaxing. There's a tree there so you can see the country-side and you've got the background with the city and the buildings, so it's a regional focus.
Related Readings (Kumar, V., Aaker, D.A. & Day, G.S. (1999). Essentials of Marketing Research. New York: John Wiley & Sons, Inc.; Zikmund, W.G. (1997). Exploring Marketing Research, 6th edition. Orlando: The Dryden Press)
Third Person
The third-person technique, more than any other projective technique, is used to elicit deep seated feelings and opinions held by respondents, that might be perceived as reflecting negatively upon the individual. People will often attribute "virtues" to themselves where they see "vices" in others. For instance, when asked why they might choose to go on an Alaskan cruise, the response might be because of the quality of the scenery, the opportunity to meet interesting people and learn about a different culture. But when the same question is asked as to why a neighbour might go on such a cruise, the response could very well be because of "brag appeal" or to show off.
By providing respondents with the opportunity to talk about someone else, such as a neighbour, a relative or a friend, they can talk freely about attitudes that they would not necessarily admit to holding themselves.
The third-person technique can be rendered more dynamic by incorporating role playing or rehearsal. In this case, the respondent is asked to act out the behaviour or express the feelings of the third person. Particularly when conducting research with children, this approach can prove to be very helpful since they "know" how others would act but cannot necessarily express it in words.
Related Readings (Kumar, V., Aaker, D.A. & Day, G.S. (1999). Essentials of Marketing Research. New York: John Wiley & Sons, Inc.; Zikmund, W.G. (1997). Exploring Marketing Research, 6th edition. Orlando: The Dryden Press)
Quantitative Research
Quantitative research is most common encountered as part of formal or conclusive research, but is also sometimes used when conducting exploratory research. Quantitative research techniques are part of primary research.
Quantitative research differs from qualitative research in the following ways:
The data is usually gathered using more structured research instruments
The results provide less detail on behaviour, attitudes and motivation
The results are based on larger sample sizes that are representative of the population,
The research can usually be replicated or repeated, given it high reliability; and
The analysis of the results is more objective.
The most common quantitative research techniques include:
Survey Techniques
The survey technique involves the collection of primary data about subjects, usually by selecting a representative sample of the population or universe under study, through the use of a questionnaire. It is a very popular since many different types of information can be collected, including attitudinal, motivational, behavioural and perceptive aspects. It allows for standardization and uniformity both in the questions asked and in the method of approaching subjects, making it far easier to compare and contrast answers by respondent group. It also ensures higher reliability than some other techniques.
If properly designed and implemented, surveys can be an efficient and accurate means of determining information about a given population. Results can be provided relatively quickly, and depending on the sample size and methodology chosen, they are relatively inexpensive. However, surveys also have a number of disadvantages, which must be considered by the researcher in determining the appropriate data collection technique.
Since in any survey, the respondent knows that s/he is being studied, the information provided may not be valid insofar as the respondent may wish to impress (e.g. by attributing him/herself a higher income or education level) or please (e.g. researcher by providing the kind of response s/he believes the researcher is looking for) the researcher. This is known as response error or bias.
The willingness or ability to reply can also pose a problem. Perhaps the information is considered sensitive or intrusive (e.g. information about income or sexual preference) leading to a high rate of refusal. Or perhaps the question is so specific that the respondent is unable to answer, even though willing (e.g. "How many times during the past month have you thought about a potential vacation destination?") If the people who refuse are indeed in some way different from those who do not, this is knows as a non-response error or bias.Careful wording of the questions can help overcome some of these problems.
The interviewer can (inadvertently) influence the response elicited through comments made or by stressing certain words in the question itself. In interview surveys, the interviewer can also introduce bias through facial expressions, body language or even the clothing that is worn. This is knows as interviewer error or bias.
Another consideration is response rate. Depending on the method chosen, the length of the questionnaire, the type and/or motivation of the respondent, the type of questions and/or subject matter, the time of day or place, and whether respondents were informed to expect the survey or offered an incentive can all influence the response rate obtained. Proper questionnaire design and question wording can help increase response rate.
There are three basic types of surveys:
Please see these excellent articles on survey administration and the right administration method for your research by Pamela Narins from the SPSS website.
Telephone
The use of the telephone has been found to be one of the most inexpensive, quick and efficient ways of surveying respondents. The ubiquity of telephone ownership as well as the use of unlisted numbers are factors that must, however, be considered as part of the sampling frame, even in North America, where the number of households with phones approaches 100%. Telephone surveys also allow for random sampling, allowing for the extrapolation of characteristics from the sample to the population as a whole.
There tends to be less interviewer bias than in interview surveys, especially if the interviewers are trained and supervised to ensure consistent interview administration. The absence of face-to-face contact can also be an advantage since respondents may be somewhat more inclined to provide sensitive information. Further, some people are reluctant to be approached by strangers, whether at their home or in a more public location, which can be overcome by the more impersonal use of the telephone.
On the other hand, telephone surveys are also known to have a number of limitations. The length of the survey has to be kept relatively short to less than 15 minutes as longer interviews can result in refusal to participate or premature termination of the call. The questions themselves must also be kept quite short and the response options simple, since there can be no visual aids such as a cue card.
The increasing use of voice mail and answering machines has made phone surveys more difficult and more costly to undertake. Calls that go answered, receive a busy signal or reach a machine, require callbacks. Usually, eligible respondents will be contacted a pre-determined number of times, before they are abandoned in favour of someone else. The potential for response bias must be considered, however, when discussing the results of a study that relied on the telephone.
The sample for a telephone survey can be chosen by selecting respondents
- from the telephone directory, e.g. by calling every 100th name
- through random-digit dialling (RDD) where the last four digits of a telephone number are chosen randomly for each telephone exchange or prefix (i.e. first three numbers), or
- the use of a table of random numbers.
The importance of randomization is discussed under probability sampling.
Two practices that are increasing in popularity and that raise considerable ethical issues, since the respondents are misled into believing that they are participating in research, are:
- the survey sell (also known as sugging), whereby products or services are sold, and
- the raising of funds for charity (also knows as frogging).
Self-Administered
Any survey technique that requires the respondent to complete the questionnaire him/herself is referred to as a self-administered survey. The most common ways of distributing these surveys are through the use of mail, fax, newspapers/magazines, and increasingly the internet, or through the place of purchase of a good or service (hotel, restaurant, store). They can also be distributed in person, for instance as part of an intercept survey. Depending on the method of survey administration, there are a number of sampling frame considerations, such as who can or cannot be reached by fax or internet, or whether there is a sample bias.
A considerable advantage of the self-administered survey is the potential anonymity of the respondent, which can lead to more truthful or valid responses. Also, the questionnaire can be filled out at the convenience of the respondent. Since there is no interviewer, interviewer error or bias is eliminated. The cost of reaching a geographically dispersed sample is more reasonable for most forms of self-administered surveys than for personal or telephone surveys, although mail surveys are not necessarily cheap.
In most forms of self-administered surveys, there is no control over who actually fills out the questionnaire. Also, the respondent may very well read part or all of the questionnaire before filling it out, thus potentially biasing his/her responses. However, one of the most important disadvantages of self-administered surveys is their low response rate. Depending upon the method of administration chosen, a combination of the following can help in improving the response rate:
- A well written covering letter of appeal, personalized to the extent possible, that stresses why the study is important and why the particular respondent should fill in the questionnaire.
- If respondents are interested in the topic and/or the sponsoring organization, they are more likely to participate in the survey; these aspects should be stressed in the covering letter
- Ensuring confidentiality and/or anonymity, and providing the name and contact number of the lead researcher and/or research sponsor should the respondent wish to verify the legitimacy of the survey or have specific questions
- Providing a due date that is reasonable but not too far off and sending or phoning at least one reminder (sometimes with another survey, in case the original one has been misplaced)
- Follow-up with non-respondents
- Providing a postage paid envelope or reply card
- Providing an incentive, particularly monetary, even if only a token
- A well designed, visually appealing questionnaire
- A shorter questionnaire, where the wording of questions has been carefully considered. For instance, it might start with questions of interest to the respondent, while all questions and instructions are clear and straight forward
- An envelope that is eye-catching, personalized and does not resemble junk mail
- Advance notification, either by phone or mail, of the survey and its intent
Interview
Face-to-face interviews are a direct communication, primary research collection technique. If relatively unstructured but in-depth, they tend to be considered as part of qualitative research. When administered as an intercept survey or door-to-door, they are usually part of quantitative research.
The opportunity for feedback to the respondent is a distinct advantage in personal interviews. Not only is there the opportunity to reassure the respondent should s/he be reluctant to participate, but the interviewer can also clarify certain instructions or questions. The interviewer also has the opportunity to probe answers by asking the respondent to clarify or expand on a specific response. The interviewer can also supplement answers by recording his/her own observations, for instance there is no need to ask the respondent’s gender or the time of day/place where the interview took place.
The length of interview or its complexity can both be much greater than in other survey techniques. At the same time, the researcher is assured that the responses are actually provided by the person intended, and that no questions are skipped. Referred to as item non-response, it is far less likely to occur in personal interviews than in telephone or self-administered surveys. Another distinct advantage of this technique is that props or visual aid can be used. It is not uncommon, for instance, to provide a written response alternatives where these are complex or very numerous. Also, new products or concepts can be demonstrated as part of the interview.
Personal interviews provide significant scope for interviewer error or bias. Whether it is the tone of voice, the way a question is rephrased when clarified or even the gender and appearance of the interviewer, all have been shown to potentially influence the respondent’s answer. It is therefore important that interviewers are well trained and that a certain amount of control is exercised over them to ensure proper handling of the interview process. This makes the interview survey one of the most costly survey methods.
Although the response rate for interviews tends to be higher than for other types of surveys, the refusal rate for intercept survey is higher than for door-to-door surveys. Whereas the demographic characteristics of respondents tend to relatively consistent in a geographically restricted area covered by door-to-door surveys, intercept surveys may provide access to a much more diversified group of respondents from different geographic areas. However, that does not mean that the respondents in intercept surveys are necessarily representative of the general population. This can be controlled to a certain extent by setting quota sampling. However, intercept surveys are convenience samples and reliability levels can therefore not be calculated. Door-to-door interviews introduce different types of bias, since some people may be away from home while others may be reluctant to talk to strangers. They can also exclude respondents who live in multiple-dwelling units, or where there are security systems limiting access.
Quota Sampling
In quota sampling, the population is first segmented into mutually exclusive sub-groups, just as in stratified sampling. Then judgement is used to select the subjects or units from each segment based on a specified proportion. It is this second step which makes the technique one of non-probability sampling.
Let us assume you wanted to interview tourists coming to a community to study their activities and spending. Based on national research you know that 60% come for vacation/pleasure, 20% are VFR (visiting friends and relatives), 15% come for business and 5% for conventions and meetings. You also know that 80% come from within the province. 10% from other parts of Canada, and 10% are international. A total of 500 tourists are to be intercepted at major tourist spots (attractions, events, hotels, convention centre, etc.), as you would in a convenience sample. The number of interviews could therefore be determined based on the proportion a given characteristic represents in the population. For instance, once 300 pleasure travellers have been interviewed, this category would no longer be pursued, and only those who state that one of the other purposes was their reason for coming would be interviewed until these quotas were filled.
Obvious advantages of quota sampling are the speed with which information can be collected, the lower cost of doing so and the convenience it represents.
Convenience Sampling
In convenience sampling, the selection of units from the population is based on easy availability and/or accessibility. The trade-off made for ease of sample obtention is the representativeness of the sample. If we want to survey tourists in a given geographic area, we may go to several of the major attractions since tourists are more likely to be found in these places. Obviously, we would include several different types of attractions, and perhaps go at different times of the day and/or week to reduce bias, but essentially the interviews conducted would have been determined by what was expedient, not by ensuring randomness. The likelihood of the sample being unrepresentative of the tourism population of the community would be quite high, since business and convention travellers are likely to be underrepresented, and – if the interview was conducted in English – non-English speaking tourists would have been eliminated.
Therefore, the major disadvantage of this technique is that we have no idea how representative the information collected about the sample is to the population as a whole. But the information could still provide some fairly significant insights, and be a good source of data in exploratory research.
Validity
Validity determines whether the research truly measures that which it was intended to measure or how truthful the research results are. In other words, does the research instrument allow you to hit "the bull’s eye" of your research object? Researchers generally determine validity by asking a series of questions, and will often look for the answers in the research of others.
Starting with the research question itself, you need to ask yourself whether you can actually answer the question you have posed with the research instrument selected. For instance, if you want to determine the profile of Canadian ecotourists, but the database that you are using only asked questions about certain activities, you may have a problem with the face or content validity of the database for your purpose.
Similarly, if you have developed a questionnaire, it is a good idea to pre-test your instrument. You might first ask a number of people who know little about the subject matter whether the questions are clearly worded and easily understood (whether they know the answers or not). You may also look to other research and determine what it has found with respect to question wording or which elements need to be included in order to provide an answer to the specific aspect of your research. This is particularly important when measuring more subjective concepts such as attitudes and motivations. Sometimes, you may want to ask the same question in different ways or repeat it at a later stage in the questionnaire to test for consistency in the response. This is done to confirm criterion validity. All of these approaches will increase the validity of your research instrument.
Probing for attitudes usually requires a series of questions that are similar, but not the same. This battery of questions should be answered consistently by the respondent. If it is, the scale items are said to have high internal validity.
What about the sample itself? Is it truly representative of the population chosen? If a certain type of respondent was not captured, even though they may have been contacted, then your research instrument does not have the necessary validity. In a door-to-door interview, for instance, perhaps the working population is severely underrepresented due to the times during which people were contacted. Or perhaps those in upper income categories, more likely to live in condominiums with security could not be reached. This may lead to poor external validity since the study results are likely to be biased and not applicable in a wider sense.
Most field research has relatively poor external validity since the researcher can rarely be sure that there were no extraneous factors at play that influenced the study’s outcomes. Only in experimental settings can variables be isolated sufficiently to test their impact on a single dependent variable.
Although an instrument’s validity presupposes that it has reliability, the reverse is not always true. Indeed, you can have a research instrument that is extremely consistent in the answers it provides, but the answers are wrong for the objective the study sets out to attain.
Reliability
The extent to which results are consistent over time and an accurate representation of the total population under study is referred to as reliability. In other words, if the results of a study can be reproduced under a similar methodology, then the research instrument is considered to be reliable.
Should you have a question that can be misunderstood, and therefore is answered differently by respondents, you are dealing with low reliability. The consistency with which questionnaire items are answered can be determined through the test-retest method, whereby a respondent would be asked to answer the same question(s) at two different times. This attribute of the instrument is actually referred to as stability. If we are dealing with a stable measure, then the results should be similar. A high degree of stability indicates a high degree of reliability, since the results are repeatable. The problem with the test-retest method is that it may not only sensitize the respondent to the subject matter, and hence influence the responses given, but that we cannot be sure that there were no changes in extraneous influences such as an attitude change that has occurred that could lead to a difference in the responses provided.
Probing for attitudes usually requires a series of questions that are similar, but not the same. This battery of questions should be answered consistently by the respondent. If it is, the instrument shows high consistency. This can be tested using the split-half method, whereby the researcher takes the results obtained from one-half of the scale items and checks them against the results of the other half.
Although the researcher may be able to prove the research instrument’s repeatability and internal consistency, and therefore reliability, the instrument itself may not be valid. In other words, it may consistently provide similar results, but it does not measure what the research proposed to determine.
Questionnaire Design and Wording
The questionnaire is a formal approach to measuring characteristics, attitudes, motivations, opinions as well as past, current and possible future behaviours. The information produced from a questionnaire can be used to describe, compare or predict these facts. Depending on the objectives, the survey design must vary. For instance, in order to compare information, you must survey respondents at least twice. If you are comparing travel intentions and travel experience, you would survey respondents before they leave on vacation and after they return to see in which ways their perceptions, opinions and behaviours might have differed from what they thought prior to experiencing the destination.
Everything about a questionnaire – its appearance, the order the questions are in, the kind of information requested and the actual words used – influences the accuracy of survey results. Common sense and good grammar are not enough to design a good questionnaire! Indeed, even the most experienced researchers must pre-test their surveys in order to eliminate irrelevant or poorly worded questions. But before dealing with the question wording and design and layout of a questionnaire, we must understand the process of measurement.
Measurements and Scaling
The first determination in any survey design is "What is to be measured?" Although our problem statement or research question will inform us as to the concept that is to be investigated, it often does not say anything about the measurement of that concept. Let us assume we are evaluating the sales performance of group sales representatives. We could define their success in numerical terms such as dollar value of sales or unit sales volume or total passengers. We could even express it in share of sales or share of accounts lost. But we could also measure more subjective factors such as satisfaction or performance influencers.
In conclusive research, where we rely on quantitative techniques, the objective is to express in numeric terms the difference in responses. Hence, a scale is used to represent the item being measured in the spectrum of possibilities. The values assigned in the measuring process can then be manipulated according to certain mathematical rules. There are four basic types of scales which range from least to most sophisticated for statistical analysis (this order spells the French word "noir"):
Nominal Scale
Some researchers actually question whether a nominal scale should be considered a "true" scale since it only assigns numbers for the purpose of catogorizing events, attributes or characteristics. The nominal scale does not express any values or relationships between variables. Labelling men as "1" and women as "2" (which is one of the most common ways of labelling gender for data entry purposes) does not mean women are "twice something or other" compared to men. Nor does it suggest that 1 is somehow "better" than 2 (as might be the case in competitive placement).
Consequently, the only mathematical or statistical operation that can be performed on nominal scales is a frequency run or count. We cannot determine an average, except for the mode – that number which holds the most responses - nor can we add and subtract numbers.
Much of the demographic information collected is in the form of nominal scales, for example:

In nominal scale questions, it is important that the response categories must include all possible responses. In order to be exhaustive in the response categories, you might have to include a category such as "other", "uncertain" or "don’t know/can’t remember" so that respondents will not distort their information by trying to forcefit the response into the categories provided. But be sure that the categories provided are mutually exclusive, that is to say do not overlap or duplicate in any way. In the following example, you will notice that "sweets" is much more general than all the others, and therefore overlaps some of the other response categories:
Which of the following do you like: (check all that apply):
| Chocolate o | Pie o |
| Cake o | Sweets o |
| Cookies o | Other o |
Ordinal Scale
When items are classified according to whether they have more or less of a characteristic, the scale used is referred to as an ordinal scale (definition of ordinal scale). The main characteristic of the ordinal scale is that the categories have a logical or ordered relationship to each other.These types of scale permit the measurement of degrees of difference, but not the specific amount of difference. This scale is very common in marketing, satisfaction and attitudinal research. Any questions that ask the respondent to rate something are using ordinal scales. For example,
How would you rate the service of our wait-staff?
| Excellent o | Very Good o | Good o | Fair o | Poor o |
Although we would know that respondent X ("very good") thought the service to be better than respondent Y ("good"), we have no idea how much better nor can we even be sure that both respondents have the same understanding of what constitutes "good service" and therefore, whether they really differ in their opinion about its quality.
Likert scales are commonly used in attitudinal measurements. This type of scale uses a five-point scale ranging from strongly agree, agree, neither agree nor disagree, disagree, strongly disagree to rate people's attitudes. Variants of the Likert-scale exist that use any number of points between three and ten, however it is best to give at least four or five choices. Be sure to include all possible responses: sometimes respondents may not have an opinion or may not know the answer, and therefore you should include a "neutral" category or the possibility to check off "undecided/uncertain", "no opinion" or "don't know".
Although some researchers treat them as an interval scale, we do not really know that the distances between answer alternatives are equal. Hence only the mode and median can be calculated, but not the mean. The range and percentile ranking can also be calculated.
Interval Scale
Interval scales (definition of interval scale) take the notion of ranking items in order one step further, since the distance between adjacent points on the scale are equal. For instance, the Fahrenheit scale is an interval scale, since each degree is equal but there is no absolute zero point. This means that although we can add and subtract degrees (100° is 10° warmer than 90°), we cannot multiply values or create ratios (100° is not twice as warm as 50°). What is important in determining whether a scale is considered interval or not is the underlying intent regarding the equal intervals: although in an IQ scale, the intervals are not necessarily equal (e.g. the difference between 105 and 110 is not really the same as between 80 and 85), behavioural scientists are willing to assume that most of their measures are interval scales as this allows the calculation of of averages mode, median and mean, the range and standard deviation.
Although Likert scales are really ordinal scales, they are often treated as interval scales. By treating this type of agreement scale or attitudinal measurement as interval, researchers can calculate mean scores which can then be compared. For instance, the level of agreement for men was 3.5 compared to 4.1 for women, or it was 3.3 for first time visitors compared to 2.8 for repeat visitors.
Ratio Scale
When a scale consists not only of equidistant points but also has a meaningful zero point, then we refer to it as a ratio scale. If we ask respondents their ages, the difference between any two years would always be the same, and ‘zero’ signifies the absence of age or birth. Hence, a 100-year old person is indeed twice as old as a 50-year old one. Sales figures, quantities purchased and market share are all expressed on a ratio scale.
Ratio scales should be used to gather quantitative information, and we see them perhaps most commonly when respondents are asked for their age, income, years of participation, etc. In order to respect the notion of equal distance between adjacent points on the scale, you must make each category the same size. Therefore, if your first category is $0-$19,999, your second category must be $20,000-$39,999. Obviously, categories should never overlap and categories should follow a logical order, most often increasing in size.
Ratio scales are the most sophisticated of scales, since it incorporates all the characteristics of nominal, ordinal and interval scales. As a result, a large number of descriptive calculations are applicable.
Question Wording

Designing questionnaires can be an exercise in cross-communication, since words often have a special meaning to some people and the key to good surveys is to elicit the information we need, but also to know what the respondents mean when they respond. Remember the conversation between Humpty Dumpty and Alice in Lewis Carroll’s "Alice in Wonderland"?
Humpty Dumpty: "…There are three hundred and sixty-four days when you might get unbirthday presents."
"Certainly", said Alice.
"And only one for birthday presents, you know. There’s glory for you."
"I don’t know what you mean by ‘glory’." Alice said.
Humpty Dumpty smiled contemptuously. "Of course you don’t – till I tell you. I meant ‘there’s a nice knock-down argument’."
"But ‘glory’ doesn’t mean ‘a nice knock-down argument’.
"It means just what I choose it to mean – neither more nor less."
Or how about this example of cross-communication from Hagar?

In order to avoid this kind of frustrating exercise in communication, let us first look at the two different question types, and then look at common errors in question wording to avoid.
Please see this very helpful article by Pamela Narins from the SPSS website on how to write more effective survey questions. And if you think only inexperienced researchers have trouble with the wording of questions, take a look at this debate over ethnic background that has been troubling the experts at Statistics Canada for years!
Question Types
There are two primary forms of questions. When respondents are given a number of predetermined responses, we are dealing with a closed or close-ended question (also known as fixed-alternative questions). If they are required to respond in their own words, we are dealing with an open or open-ended question.
Closed questions are much easier to interpret since they are standardized and therefore can be analyzed statistically. They are also quicker to complete for the respondent, but they are more difficult to write since the answers must be anticipated in advance. Ultimately, the respondent is being asked to choose the answer that is closest to their own viewpoints, but not necessarily their point of view. All too often the choices presented in closed questions could be answered with "it depends…"! For instance,

The answer could clearly depend on how long a flight it is. For instance, you might be willing to put up with a lot of discomfort if the price is right and the flight is only short, but would prefer to pay a bit more for a long-haul or transcontinental flight in order to have more leg and arm room.
There are basically four different types of closed-ended questions:
1) Simple dichotomy: requires respondent to choose one of two alternatives, e.g. "yes"/"no"

Open questions, which are also known as free-answer questions, allow the respondent to answer in their own words. While they can provide an extremely useful set of responses, and do not require that the answer be anticipated, they can also present some significant problems when trying to code and analyze the information resulting from them. But how you catalogue answers can introduce serious bias. For instance, when asked:
"How often during the past month did you search for information about specific destinations?"
possible responses could be:
"Not often" "A few times" "A bit less than the month before" "A couple of times a week"
Do all of these answers mean the same thing? Much is left to the researcher’s interpretation. Correct interpretation of most open-ended questions requires expertise and experience.
A combination of open and closed question is often used to identify and compare what respondents will state spontaneously and what they will choose when given categories of responses. For instance, the open question:
"What do you think are the major issues facing your organization?"
______________________________________________________
could be followed up with a checklist question:

Use the following checklist developed by Arlene Fink (1995). How to Ask Survey Questions. Sage Publications, to help you determine whether to use open or closed questions:
|
If yes, use OPEN |
If yes, use CLOSED |
|
|---|---|---|
|
Purpose |
Respondents’ own words are essential (to please respondent, to obtain quotes, to obtain testimony) | You want data that are rated or ranked (on a scale of very poor to very good, for example) and you have a good idea of how to order the ratings in advance |
| Respondents’ characteristics | Respondents are capable of providing answers in their own words
Respondents are willing to provide answers in their own words |
You want respondents to answer using a pre-specified set of response choices |
| Asking the question | You prefer to ask only the open question because the choices are unknown | You prefer that respondents answer based on a pre-determined set of choices |
| Analyzing the results | You have the skills to analyze respondents’ comments even though answers may vary considerably
You can handle responses that appear infrequently |
You prefer to count the number of choices |
| Reporting the results | You will provide individual or grouped verbal responses | You will report statistical data |
Considerations in Wording
Words are extremely powerful and we react instinctively to their underlying meanings. Knowing how to word questions in a neutral yet effective is therefore an art to which many books have been dedicated.
There are a number of common errors in question wording that should be avoided.
1. Loaded words, or words that stir up immediate positive or negative feelings. When loaded words are used, respondents react more to the word itself than to the issue at hand. Not surprisingly, the estimated speed of the car was much higher for group A than for group B in the following experiment:
Two groups of people (A & B) were shown a short film about a car crash. Group A was asked "How fast was car X going when it smashed into car Y?" while Group B was asked "How fast was car X going when it contacted car Y?"
Many similar experiments have shown the power of words to introduce such a bias.
2. Loaded response categories, or providing a range of responses that will skew the answers in one direction or another. In the following example:
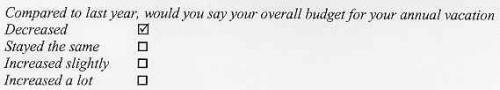
You have biased the answers towards "increase" since there are two categories that address degrees of increase, compared to only one category for a potential decrease. You need to balance this scale by changing "decreased" to "decreased a lot" and "decreased slightly".
3. Leading questions, or questions that suggest socially acceptable answers or in some way intimate the viewpoint held by the researcher, can lead respondents to answer in a way that does not reflect their true feelings or thoughts. For instance, in a survey about all-inclusive holidays, the question "How much time did you devote to your child(ren) during your vacation?" will lead people to overestimate the time spent, since to answer "I did not spend any time or little time" would almost be like saying they were not devoted to their offspring. It is very important to find words that do not make assumptions about the respondents or are neutral in nature.
4. Double-barrelled questions are questions that require more than one answer, and therefore should be broken into at least two questions. For instance, "How would you rate the quality of service provided by our restaurant and room-service staff?" does not allow you determine which is being rated, the restaurant staff or the room-service staff, nor whether either or both were used. It would be far better to have separate questions dealing with these issues.
5. Vague words or phrases can pose a special problem, since sometimes you want to be deliberately vague because you are exploring an issue and don’t want to pre-determine or influence the answers being considered. However, there are some common rules that you can follow:
- Always specify what "you" refers to as in "you, personally" or "you and your family"
- Always give a precise time frame: "How often in the last two months…", "In 1998…(not "last year")", "July and August (instead of "during the summer")"
- Stay away from terms such as "rarely" or "often", if you can since they can be interpreted in many different ways. Use terms such as "once a month", "several times a week" that are more specific.
- When probing for specific quantitative details, don’t tax the respondent’s memory unreasonably. "How many ads for different destinations did you see in the last month?" is an almost impossible question to answer even though the time frame is ‘only’ a month. Since most of us are inundated with advertising messages of all types, you cannot expect a meaningful answer. It would be better to probe for destinations that have stood out or ads that have marked the respondent in some way.
6. Offensive or threatening questions, even if inadvertent, can lead to a dishonest answer or refusal. This applies even to a blunt question about income as in "What is your income?_______" It is better to rephrase such a question by providing broad categories, for example
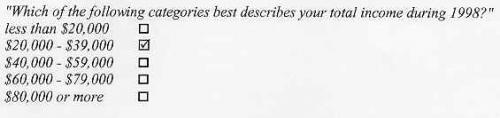
It is rare that you really need very precise income information, and for most types of research this type of broad category would be sufficient. This is part of the considerations around "nice to know" information versus information needed to specifically answer the research problem.
7. Jargon, acronyms and technical language should be avoided in favour of more conversational language and the use of terms that are readily understood by everyone. It should not be taken for granted, for instance, that everyone would be familiar with even relatively common terms such as "baby boomer", "GTA" or "brand image", and it is far better to spell them out: "those born after the Second World War but before 1960", "the cities in the Oshawa-Hamilton corridor" and "the image reflected by the name or symbol used to identify a service provided", even if this may appear to be cumbersome.
Pamela Narins, the Market Research Manager for SPSS, has prepared some excellent pointers on how to "write more effective survey questions". Be sure to check them out!
Design and Layout
The design of the questionnaire will determine whether the data collected will be valid and reliable. Although the researcher’s input is invaluable, ultimately the responsibility for approving the questionnaire lies with the manager. Therefore, s/he must be able to not only evaluate the questionnaire itself, but also the specific wording of questions.
There are three steps to questionnaire design:
- What information is needed to answer the research question(s): this requires a thorough understanding of the research objectives and data gathering method chosen as well as of the respondents’ reaction to the research and willingness to provide the information needed;
- How are the questions to be asked, that is to say the types of questions that will be used and the actual wording; and
- In which order will the questions be asked: this includes the visual layout and physical characteristics of the questionnaire (see layout and sequencing), and the pretesting of the instrument to ensure that all steps are properly carried out.
Layout and Sequencing
Probably the most challenging questionnaires to design are for self-administered surveys, since their appearance is critical in motivating respondents. If the font is too small, the instructions confusing, the look unprofessional or cluttered, you can be sure that it will have an immediate impact on both the overall response rate and non-response error.
Even if there is a covering letter to accompany the survey, it is a good idea to reiterate the key points about the importance of the survey, due date and where to return it at the top of the questionnaire, in case it gets separated from the covering letter. It is critical that the first several questions engage the respondent. They should also be relevant to the study itself so that the respondent quickly understands what the survey is about and becomes engaged in is objectives. These questions should be straightforward with relatively few categories of response. Also, respondents should not be asked to agree or disagree with a position at the outset, but rather eased into the survey by asking them what they think is important or what they prefer.
Because of these considerations, it is not a good idea to put demographic questions at the beginning of the questionnaire. Since they are easy to answer and often seen as simple "housekeeping" items, they are much better at the end when respondents are getting tired. The same holds true for any questions considered a bit more sensitive. If placed too early, they can lead the respondent to abandon and it is better that there only be one or two questions at the end that suffer from non-response bias rather than that the response rate as a whole be reduced.
Questions themselves should be grouped in sections, and these sections should have a logical sequence. You want to avoid making the respondent "jump around" mentally, and if necessary, may even want to help him/her "shift gears" by introducing a new section. For instance, "Now we will shift slightly to ask about…" or "We would like to get your opinion on some related areas" can help the respondent travel through the questionnaire or interview.
One other important aspect to watch out for is "position bias". This bias can occur in lists, where the first items are treated differently (often seen as more important) from the last items. It is therefore a good idea to have several versions of the questionnaire, where this is an option, and change the order of the lists in question.
Instructions should clearly stand out. Too often, it is the questions themselves that are bolded or italicized, rather than the instructions. Remember that respondents will always read the questions, but unless their attention is really drawn to the instructions, they are likely to skip these. This could lead to response error, particularly if you are asking them to skip certain questions based on their response.
Be sure to also consider coding of the questionnaire to save time and confusion during the data entry stage. Whatever rationale you chose for coding, it should be discreet (i.e. not distract the respondent in a self-administered questionnaire) and consistent throughout.
Pamela Narins, the Market Research Manager for SPSS, has written some excellent "guidelines for creating better questionnaires" that you should definitely check out!
Pretesting
No matter how experienced you are in developing questionnaires or how "routine" the survey might be considered, it is always important to pretest your instrument before it is printed and fielded. Start by reading it aloud – the flow of words should sound conversational/read smoothly and communicate clearly. Instructions should not leave any doubt about what the respondent is supposed to do. Check each question carefully to ensure that it will indeed provide the information you need, and that the meaning of every word is clear. Go back and revise your survey!
Next, give the questionnaire to a small group of people, who preferably know little or nothing about the research itself. Ask them to read the questionnaire to see if they, too, can clearly understand what is required and whether the flow makes sense to them. Go back and revise your survey!
And finally, select a small number of people from your sampling frame, if at all possible, and test your questionnaire with them (even if your questionnaire turns out to be "pretty good", you should not include these respondents in your final sample). Look at the frequency distribution: if there are too many "neutral", "don’t know" or "don’t remember" responses, you need to revise the questions themselves. If the questions that require a written response look too "squished", provide more generous spacing.
You should ask the respondents to also comment on the questionnaire itself, and on whether you should perhaps be asking some additional questions relevant to the research problem as stated in the introduction. Since people are often reluctant to admit that they might have difficulty responding, ask them whether they believe other people would have difficulty and which questions in particular might pose problems? You will elicit many useful comments, so: Go back and revise your survey!
And remember that you will have to go through the same steps for each language used for the survey, and that you will need to check for cultural and regional differences as well in these cases.
Pamela Narins, the Market Research Manager for SPSS, has provided "13 important tips to help you pretest your surveys" that you should definitely check out!
Sampling and Sample Design

The procedure by which a few subjects are chosen from the universe to be studied in such as way that the sample can be used to estimate the same characteristics in the total is referred to as sampling. The advantages of using samples rather than surveying the population are that it is much less costly, quicker and, if selected properly, gives results with known accuracy that can be calculated mathematically. Even for relatively small samples, accuracy does not suffer even though precision or the amount of detailed information obtained, might. These are important considerations, since most research projects have both budget and time constraints.
Determining the population targeted is the first step in selecting the sample. This may sound obvious and easy, but is not necessarily so. For instance, in surveying "hotel guests" about their experiences during their last stay, we may want to limit the term to adults aged 18 or older. Due to language constraints, we may want to include only those guests that can speak and/or read English. This more operational definition of population would be considered the "respondent qualifications". They make the research more doable, but also introduce delimitations of the study’s scope.
Next, the sampling units themselves must be determined. Are we surveying all hotel guests that fit our operational definition, one person per room occupied, one person per party (and who?), households, companies, etc.?
The list from which the respondents are drawn is referred to as the sampling frame or working population. It includes lists that are available or that are constructed from different sources specifically for the study. Directories, membership or customer lists, even invoices or credit card receipts can serve as a sampling frame. However, comprehensiveness, accuracy, currency, and duplication are all factors that must be considered when determining whether there are any potential sampling frame errors. For instance, if reservations and payments for certain business travellers is made by their companies without specifying the actual guest name, these would not be included if the sampling frame is the hotel’s guest list. This could lead to potential underrepresentation of business travellers.
Please see these two helpful articles by Pamela Narins from the SPSS site about calculating the Survey Sample Size and correcting the Finite Population. Also, this article by Susanne Hiller from the National Post highlights the problems you can run into in interpreting survey results when your sample size is too small. In this article published in the Globe and Mail on Consistent Mistakes that Plague Customer Research, George Stalk, Jr. and Jill Black discuss common problems and their implications. Reuter's Washington office reported on the misuse of polls and how results can be biased because of the question wording in this Toronto Star article dealing with the Microsoft case.
Probability Sampling Techniques
In probability sampling, the sample is selected in such a way that each unit within the population or universe has a known chance of being selected. It is this concept of "known chance" that allows for the statistical projection of characteristics based on the sample to the population.
Most estimates tend to cluster around the true population or universe mean. When plotted on a graph, these means form what is called the normal or bell curve. This theoretical distribution allows for the calculation of the probability of a certain event occurring (e.g. the likelihood that an activity studied will be undertaken by people over 65 years old, if those are the variables being studied).
There are three main types of probability or random sampling that we will review more closely:
Non-Probability Sampling Techniques
In non-probability sampling, the sample is selected in such a way that the chance of being selected of each unit within the population or universe is unknown. Indeed, the selection of the subjects is arbitrary or subjective, since the researcher relies on his/her experience and judgement. As a result, there are no statistical techniques that allow for the measurement of sampling error, and therefore it is not appropriate to project the sample characteristics to the population.
In spite of this significant shortcoming, non-probability sampling is very popular in hospitality and tourism research for quantitative research. Almost all qualitative research methods rely on non-probability sampling techniques.
There are three main types of non-probability sampling that we will review more closely:
4. Data Gathering
Once the data collection method has been developed and pre-tested, we proceed to the gathering of the information we wish to collect. This is where a number of nonsampling errors can occur. These cover all errors that are not related to the sampling plan or the sample size, and that cannot be calculated. However, some of these can be controlled when procedures are set up properly.
During the data gathering phase, nonsampling errors can derive from errors committed by the fieldworker (in the case of telephone or personal interviews and surveys) or by the respondents themselves. In both cases, errors can be intentional or unintentional.
Errors by fieldworkers are referred to as interviewer error (or bias) and can be the result of cheating (e.g., filling out the survey instead of questioning a respondent or choosing a different respondent than the one designated by the sampling plan); leading the respondent by suggesting answers; fatigue due to stretches of interviewing that are too long and tedious; and mistakes in administering the survey correctly, especially if there are skip patterns. Finally, interviewers can also introduce bias through their appearance, demeanor and even their age or gender. Interviewer training, careful supervision, reasonable compensation and validation of completed surveys are some of the techniques to control for interviewer error. A rule of thumb suggests that at least 10% of completed surveys or interviews should be verified by re-contacting the respondent. Unfortunately, this is not possible in anonymous surveys.
Respondent errors can also be the result of cheating (e.g., pretending to match the screening criteria or passing oneself off as different from reality by inflating educational attainment or income, for instance) or introducing bias (non-response error) by choosing not to respond to the survey or to certain questions. Incentives can help in reducing these types of intentional errors but if too appealing, can also lead to more cheating to qualify for the survey. Refusals and item omissions can be calculated as a percentage and should be reported along with the findings. There are a number of tools available to calculate response rates, such as this one by Answers Research Inc.
Unintentional respondent errors are usually due to incorrect interpretation of a question as well as fatigue and distractions. This is why pre-testing a questionnaire is so important: it tells us not only whether questions are understood correctly but also whether it is too long to maintain the respondent’s attention.
5. Data Processing and Analysis
After questionnaire development, pretesting the instrument and designing the sample, fieldwork – or the actual gathering of the required data – must be undertaken. However, we will not be discussing the complex and expensive tasks associated with fieldwork as part of this course.
Once the results start to come back from the field, the information needs to be prepared for input in order to be tabulated and analyzed. Before the questionnaires are given to someone for data-entry, they must be edited and coded. There should be no ambiguity as to what the respondent meant and what should be entered. This may sound simple, but what do you do in the following case:

So is it their first trip or not? And what do you instruct the data-entry person to do? In spite of clear instructions, this type of confusing response is not as rare as we might think, particularly in self-administered surveys.
If the questionnaire was not pre-coded, this will be done at the same time as the editing by the researcher. Coding involves assigning a label to each question or variable (as in "q15" or "1sttrip") and a number or value to each response category (for instance 1 for "yes" and 2 for "no"). Sometimes, people will write in a response such as "can’t remember" or "unsure", and the editor must decide on what to do. This could either be ignored or a new code and/or value could be added. All of these decisions as well as the questions and their codes are summarized in a "codebook" for future reference. Pamela Narins and J. Walter Thomson of SPSS have prepared some basic guidelines for preparing for data entry, that you should be sure to read.
Even in a structured questionnaire, you may have one or two open-ended questions, which do not lend themselves to coding. This type of question needs to be content analyzed and hopefully grouped into categories that are meaningful. At this point, they can be either tabulated manually or codes can be established for them.
Once the data has been input into the computer, usually with the assistance of a statistical package such as SPSS, it needs to be ‘cleaned’. This is the process of ensuring that the data entry was correctly executed and correcting any errors. There are a number of ways for checking for accuracy:
- Double entry: the data is entered twice and any discrepancies are verified against the original questionnaire;
- Running frequency distributions and scanning for errors in values based on the original questionnaire (if only four responses are possible, there should be no value "5", for instance); and
- Data listing refers to the printout of the values for all cases that have been entered and verifying a random sample of cases against the original questionnaires.
The objective is of course to achieve more accurate analysis through data cleaning, as explained by Pamela Narins and J. Walter Thompson of SPSS.
The data is now ready for tabulation and statistical analysis. This means that we want to do one or more of the following:
- Describe the background of the respondents, usually using their demographic information;
- Describe the responses made to each of the questions;
- Compare the behaviour of various demographic categories to one another to see if the differences are meaningful or simply due to chance;
- Determine if there is a relationship between two characteristics as described; and
- Predict whether one or more characteristic can explain the difference that occurs in another.
In order to describe the background of the respondents, we need to add up the number of responses and report them as percentages in what is called a frequency distribution (e.g. "Women accounted for 54% of visitors."). Similarly, when we describe the responses made to each of the questions; this information can be provided as a frequency, but with added information about the "typical" response or "average", which is also referred as measure of central tendency (e.g. "On average, visitors returned 13 times in the past five years".)
In order to compare the behaviour of various demographic categories to one another to see if the differences are meaningful or simply due to chance, we are really determining the statistical significance by tabulating two or more variables against each other in a cross-tabulation (e.g. "There is clear evidence of a relationship between gender and attendance at cultural venues. Attendance by women was statistically higher than men’s".).
If we wish to determine if there is a relationship between two characteristics as described; for instance the importance of predictable weather on a vacation and the ranking of destination types, then we are calculating the correlation. And finally, when trying to predict whether one or more characteristic can explain the difference that occurs in another, we might answer a question such as "Are gender, education and/or income levels linked to the number of times a person attends a cultural venue?
Frequency Distribution
The tally or frequency count is the calculation of how many people fit into a certain category or the number of times a characteristic occurs. This calculation is expressed by both the absolute (actual number) and relative (percentage) totals.
The example below is a typical output by the statistical software package SPSS. It provides us with the following information by column, starting from left to right:
- Column 1: the "valid" or useable information obtained as well as how many respondents did not provide the information and the total of the two.
- Column 2: the names of the "values" or choices people had in answering the particular question (in this case "high school or less", "some college/university", "graduated college/university or more") the total of these values and the reason why the information is missing. "System" refers to an answer that was not provided. Other choices might be "don’t know", "not applicable" or "can’t remember", which we might wish to discount in our total.
- Column 3: "frequency" refers to the actual number of respondents. As we can see, 95 people had a high school or less education, 263 had some college or university and 790 had graduated college/university or more, for a total of 1148. 60 people did not provide an answer, for a total of 1208 respondents in the survey. (This number should almost always be the same for all questions analyzed, although the number of "missing" could vary widely.)
- Column 4: "percent" is the calculation in percentage terms of the relative weight of each of the categories, but taking the full number of 1208 respondents in the survey as the base. Since we are rarely interested in including the ‘missing’ category as part of our analysis, this percentage is rarely used.
- Column 5: "valid percent" is the calculation in percentage terms of the relative weight of each of the "valid" categories only. Hence it uses only those who responded to the question, or 1148, for the calculation. It is this column that is normally used for all data analysis.
- Column 6: when adding the valid percent column together row by row, you get the corresponding "cumulative percentage". In this example, "high school or less" (8.3) plus "some college/university (22.9) equals the cumulative percentage of 31.2 (8.3 + 22.9). When you add the third category of "graduated college/university or more" (68.8) to the first two, you will reach 100. This column is particularly useful when dealing with many response categories and trying to determine where the median falls.
Highest level of education
|
Frequency |
Percent |
Valid Percent |
Cumulative Percent |
||
| Valid | high school or less |
95 |
7.9 |
8.3 |
8.3 |
| some college/university |
263 |
21.8 |
22.9 |
31.2 |
|
| graduated college/ university or more |
790 |
65.4 |
68.8 |
100.0 |
|
| Total |
1148 |
95.0 |
100.0 |
||
| Missing | System |
60 |
5.0 |
||
|
Total |
1208 |
100.0 |
There are two common ways of graphically representing this information. The first is in the form of a pie chart (Figure 1), which takes the percentage column and represents it in the form of pieces of pie based on the percentage for each category. You will notice that any graph should be given a number (e.g. Figure 1), a title (e.g. Highest level of education) and the total number of respondents that participated in the survey (n=1208). Pie charts should be used to only to express percentages or proportions, such as marketshare.


Another way to graph the information is through a bar chart (Figure 2). In this case, we used a simple bar graph. Notice also that you are able to eliminate the missing category from the graph and therefore base the analysis on the 1148 respondents who answered this particular question. This is preferable to using a pie chart in the SPSS program, which will not allow you to eliminate the missing cases.
Line charts are used when plotting the chance in a variable over time. For example, if this same study had been undertaken every two years for the past ten, you might want to present this information graphically by showing the evolution in each education level with a line.
Calculation of Central Tendencies
Measures of central tendency describe the location of the center of a frequency distribution. There are three different measures of central tendency: the mode, median and mean.
The mode is simply the value of the observation that occurs most frequently. It is useful when you want the prevailing or most popular characteristic or quality. In a survey of adults aged 18 or older, the question "What is your age?" was answered as follows:
What is your age?
| Frequency | Percent | Valid Percent | Cumulative Percent | ||
| Valid | 18 | 17 | 1.1 | 1.1 | 1.1 |
| 19 | 14 | 0.9 | 0.9 | 2.1 | |
| 20 | 12 | 0.8 | 0.8 | 2.9 | |
| 21 | 21 | 1.4 | 1.4 | 4.3 | |
| 22 | 14 | 0.9 | 0.9 | 5.2 | |
| 23 | 24 | 1.6 | 1.6 | 6.8 | |
| 24 | 13 | 0.9 | 0.9 | 7.7 | |
| 25 | 25 | 1.7 | 1.7 | 9.3 | |
| 26 | 21 | 1.4 | 1.4 | 10.7 | |
| 27 | 23 | 1.5 | 1.5 | 12.3 | |
| 28 | 21 | 1.4 | 1.4 | 13.7 | |
| 29 | 20 | 1.3 | 1.3 | 15 | |
| 30 | 27 | 1.8 | 1.8 | 16.8 | |
| 31 | 20 | 1.3 | 1.3 | 18.1 | |
| 32 | 20 | 1.3 | 1.3 | 19.5 | |
| 33 | 24 | 1.6 | 1.6 | 21.1 | |
| 34 | 25 | 1.7 | 1.7 | 22.7 | |
| 35 | 27 | 1.8 | 1.8 | 24.5 | |
| 36 | 27 | 1.8 | 1.8 | 26.3 | |
| 37 | 19 | 1.3 | 1.3 | 27.6 | |
| 38 | 36 | 2.4 | 2.4 | 30 | |
| 39 | 32 | 2.1 | 2.1 | 32.1 | |
| 40 | 33 | 2.2 | 2.2 | 34.3 | |
| 41 | 31 | 2.1 | 2.1 | 36.4 | |
| 42 | 42 | 2.8 | 2.8 | 39.2 | |
| 43 | 32 | 2.1 | 2.1 | 41.3 | |
| 44 | 39 | 2.6 | 2.6 | 43.9 | |
| 45 | 34 | 2.3 | 2.3 | 46.2 | |
| 46 | 47 | 3.1 | 3.1 | 49.3 | |
| 47 | 30 | 2 | 2 | 51.3 | |
| 48 | 39 | 2.6 | 2.6 | 53.9 | |
| 49 | 33 | 2.2 | 2.2 | 56.1 | |
| 50 | 40 | 2.7 | 2.7 | 58.8 | |
| 51 | 27 | 1.8 | 1.8 | 60.6 | |
| 52 | 39 | 2.6 | 2.6 | 63.2 | |
| 53 | 31 | 2.1 | 2.1 | 65.3 | |
| 54 | 24 | 1.6 | 1.6 | 66.9 | |
| 55 | 38 | 2.5 | 2.5 | 69.4 | |
| 56 | 25 | 1.7 | 1.7 | 71.1 | |
| 57 | 22 | 1.5 | 1.5 | 72.5 | |
| 58 | 24 | 1.6 | 1.6 | 74.1 | |
| 59 | 21 | 1.4 | 1.4 | 75.5 | |
| 60 | 43 | 2.9 | 2.9 | 78.4 | |
| 61 | 29 | 1.9 | 1.9 | 80.3 | |
| 62 | 28 | 1.9 | 1.9 | 82.2 | |
| 63 | 25 | 1.7 | 1.7 | 83.9 | |
| 64 | 19 | 1.3 | 1.3 | 85.1 | |
| 65 | 39 | 2.6 | 2.6 | 87.7 | |
| 66 | 20 | 1.3 | 1.3 | 89.1 | |
| 67 | 14 | 0.9 | 0.9 | 90 | |
| 68 | 22 | 1.5 | 1.5 | 91.5 | |
| 69 | 25 | 1.7 | 1.7 | 93.1 | |
| 70 | 19 | 1.3 | 1.3 | 94.4 | |
| 71 | 9 | 0.6 | 0.6 | 95 | |
| 72 | 20 | 1.3 | 1.3 | 96.3 | |
| 73 | 8 | 0.5 | 0.5 | 96.9 | |
| 74 | 16 | 1.1 | 1.1 | 97.9 | |
| 75 | 10 | 0.7 | 0.7 | 98.6 | |
| 76 | 4 | 0.3 | 0.3 | 98.9 | |
| 77 | 4 | 0.3 | 0.3 | 99.1 | |
| 78 | 4 | 0.3 | 0.3 | 99.4 | |
| 79 | 1 | 0.1 | 0.1 | 99.5 | |
| 80 | 4 | 0.3 | 0.3 | 99.7 | |
| 81 | 1 | 0.1 | 0.1 | 99.8 | |
| 82 | 1 | 0.1 | 0.1 | 99.9 | |
| 84 | 1 | 0.1 | 0.1 | 99.9 | |
| 86 | 1 | 0.1 | 0.1 | 100 | |
| Total | 1500 | 100 | 100 |
Hence the mode is 46, since 47 respondents provided this answer, more than any other category. Since there is only one mode in this distribution, it is referred to as ‘unimodal’. If a distribution has two modes (or two values that have the same amount of responses that are also the highest), it is referred to as ‘bimodal’.
The median is the middle observation, where half the respondents have provided smaller values, and half larger ones. It is calculated by arranging all observations from lowest to highest score and counting to the middle value. In our example above, the median is 47. The cumulative percentage will tell you at a glance where the median falls. Since the median is not as sensitive as the mean to extreme values, it is used most commonly in cases where you are dealing with ‘outliers’ or extreme values in the distribution that would skew your data in some way. The median is also useful when dealing with ordinal data and you are most concerned with a typical score.
The mean is also known as the ‘arithmetic average’ and is symbolized by ‘X’. The formula for calculating the mean is ∑ X/n (The Greek letter sigma ∑ is the symbol for sum) This means that you total all responses (X) and then divide them by the total number of observations (n). In our example, you would have to multiply all the values (actual ages or ‘x’) by the number of respondents or frequencies (‘f’) for each (∑ x • f = X or. 18 • 17 + 19 • 14 + etc.) and then divide the total by the 1500 respondents who participated in the survey. The result is 47.04. Since the computer will follow the same steps, you must be sure that the values are real and not just codes for categories. For example, the computer would calculate a mean of 3.7367 for the same information as the frequency above but recoded into age categories, based on the assumption that the values under x are 1 to 6:
What is your age?
| Frequency | Percent | Valid Percent | Cumulative Percent | ||
| Valid | 18-24 years (1) | 115 | 7.7 | 7.7 | 7.7 |
| 25-34 years (2) | 226 | 15.1 | 15.1 | 22.7 | |
| 35-44 years (3) | 318 | 21.2 | 21.2 | 43.9 | |
| 45-54 years (4) | 344 | 22.9 | 22.9 | 66.9 | |
| 55-64 years (5) | 274 | 18.3 | 18.3 | 85.1 | |
| 65 years or more (6) | 223 | 14.9 | 14.9 | 100 | |
| Total | 1500 | 100 | 100 |
Another useful calculation is the range, the calculation of the spread of the numerical data. It is calculated by subtracting the lowest value (in our example 18) from the highest value (or 86) to give us a total of 68. This is particularly useful when dealing with rating scores, for instance, where you would like to determine how close people are in agreement or alternatively, how wide the discrepancies are.
Cross Tabulations
When you want to know how respondents answered on two or more questions at the same time, you will need to run a cross-tabulation. In order to do so, you must first determine which is your independent variable, and which your dependent variable, since the first is traditionally used as column headings and the latter are found in the row.
Independent variables explain or predict a response or an outcome, which is the dependent variable under study. As a basic rule, demographic information is usually considered independent, since characteristics such as gender, age, education etc. will normally determine the responses we make. If the variables being studied are not demographic, then the independent variable is determined by the study’s objectives. For instance, if the objective is to determine whether the level of satisfaction with the past holiday at a destination influences the likelihood of return, then level of satisfaction is our independent variable and the likelihood to return the dependent one.
This is the typical output of a simple cross-tabulation (of education levels and overall satisfaction with a holiday) as produced by SPSS, when we also ask that column percentage be calculated. Note that the title gives the two variables with the dependent one first separated by *. When producing this information in a table, we would reword it to read "Overall holiday satisfaction by highest level of education completed" ( see Table 1), removing all extraneous information and leaving it as a statement, not a question.
Overall satisfaction with your holiday * What is the highest level of education completed Crosstabulation
Obviously, you would not be able to use this table as is in a report. It requires ‘cleaning’. Your first consideration would be whether you want to keep all of the categories in your independent and dependent variable. This depends, of course, on what you are trying to illustrate and the responses in each cell. First of all, very few people have less than a high school degree, and we could therefore collapse the first two categories into ‘high school or less’. But that still leaves us with five categories or more detail than we would probably need. So we could collapse the categories ‘graduated from technical or vocational school’ and ‘some college/university’ into ‘some advanced education’ and the last two into ‘graduated from university or more’. Similarly, we notice that the level of satisfaction with the holiday is very high. Indeed, any rows with less than 5% of respondents in cells should be collapsed. At the very least we should only have one category ‘not at all or nor very satisfied’. This collapsing of categories is knows as recoding and is a way of changing existing variables or creating new variables based on existing data as explained by John Urbik, the Technical Marketing Specialist for SPSS.
The resultant cross-tabulation would look like this:
overall satisfaction with holiday * highest level of education Crosstabulation
| What is the highest level of education completed | Total | |||||||||
| Primary school (grade 1-7) | Some high school | Graduated from high school | Graduated from a technical or vocational school | Some college or university | Graduated from university | Graduated with an advanced degree | ||||
| Overall satisfaction with your holiday | Not at all satisfied | Count | 2 | 1 | 1 | 1 | 5 | |||
| % within What is the highest level of education completed | 0.60% | 0.40% | 0.50% | 1.10% | 0.40% | |||||
| Not very satisfied | Count | 2 | 6 | 8 | 8 | 2 | 1 | 2 | 29 | |
| % within What is the highest level of education completed | 6.70% | 1.80% | 3.00% | 4.00% | 1.40% | 0.40% | 2.20% | 2.20% | ||
| Somewhat satisfied | Count | 3 | 40 | 37 | 25 | 30 | 42 | 12 | 189 | |
| % within What is the highest level of education completed | 10.00% | 11.80% | 13.70% | 12.60% | 21.30% | 15.80% | 13.00% | 14.20% | ||
| Very satisfied | Count | 25 | 290 | 224 | 164 | 109 | 223 | 77 | 1112 | |
| % within What is the highest level of education completed | 83.30% | 85.80% | 83.00% | 82.80% | 77.30% | 83.80% | 83.70% | 83.30% | ||
| Total | Count | 30 | 338 | 270 | 198 | 141 | 266 | 92 | 1335 | |
| % within What is the highest level of education completed | 100.00% | 100.00% | 100.00% | 100.00% | 100.00% | 100.00% | 100.00% | 100.00% |
We can now proceed to present this information in a more pleasing table format by giving it the appropriate table number and title, indicating the total number of respondents who answered this question, and cleaning the table, as follows:
Table 1: Overall holiday satisfaction by highest level of education
n=1243
| Degree of Satisfaction | Level of education | ||
| High school or less | Some advanced education | Graduated university of more | |
| Not at all or not very |
10 2.7% |
18 3.8% |
3 .7% |
| Somewhat |
43 11.7% |
62 13.2% |
72 17.7% |
| Very |
315 85.6% |
388 82.9% |
332 81.6% |
| Total |
368 100% |
468 100% |
407 100% |
Graphically, we would follow very similar rules: the graph is numbered (Figure 1) with the same title and the number of respondents indicated; the independent variable identifies the columns since we want to compare the satisfaction level of each of the three education categories. It is the column percentage that is used for comparison purposes. The type of graph below is called a clustered bar chart.
Calculating the Chi-Square
The chi-square (pronounced ‘kai’) distribution is the most commonly used method of comparing proportions. Its symbolized by the Greek letter chi or χ2). This test makes it possible to determine whether the difference exists between two groups and their preference or likelihood of doing something is real or just a chance occurrence. In other words, it determines whether a relationship or association exists between being in one of the two groups and the behaviour or characteristic under study. If in a survey of 692 respondents we asked whether or not they are interested attending attractions and events that deal with history and heritage during their vacation, and we wanted to determine whether there is a difference in how men and women respond to this question, we could calculate a chi-square.
χ2 determines the differences between the observed (fo) and expected frequencies (fe). The observed frequencies are the actual survey results, whereas the expected frequencies refer to the hypothetical distribution based on the overall proportions between the two characteristics if the two groups are alike. For example, if we have the following survey results:
| Observed frequencies | |||
| History & Heritage | Men | Women | Total |
| Yes | 95 | 159 | 254 |
| No | 199 | 239 | 438 |
| Total | 294 | 398 | 692 |
Then we can calculate our expected frequencies (fe) based on the proportion of respondents who said ‘yes’ versus ‘no’. It can also be calculated for each cell by the row total with the column total divided by the grand total (e.g. 254 x 294 : 692 = 108).
| Expected frequencies | |||
| History & Heritage | Men | Women | Total |
| Yes | 108 | 146 | 254 |
| No | 186 | 252 | 438 |
| Total | 294 | 398 | 692 |
This second table, where no relationship exists between the interest in attending history and heritage attractions and events and gender, also represents the null hypothesis or Ho. (Therefore, if a study says that it "fails to reject the null hypothesis", it means that no relationship was found to exist between the variables under study.)

Hence, the calculation is as follows:
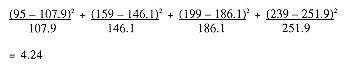
The critical value for a level of significance of .05 (or 95% level of confidence, the normal level in this type of research) is 3.841. This means that you are confident that 95% of the distribution falls below this critical value. Since our result is above this value, we can:
- Reject the null hypothesis that no difference exists between interest in attending historical attractions and events and gender (in other words, there is a difference between genders); and
- Conclude that the differences in the groups are statistically significant (or not due to chance)
You will not need to memorize all the critical values since computer programs such as SPSS will not only calculate the χ2 values for you, but will also give you the precise level of observed significance (known as p value), which in our case is .039. If this level of significance is above the standard .05 level of statistical significance, you are dealing with a statistically significant relationship.
Determining Correlation
A correlation is used to estimate the relationship between two characteristics. If we are dealing with two ordinal or one ordinal and one numerical (interval or ratio) characteristic, then the correct correlation to use is the Spearman rank correlation, named after the statistician, also known as rho or rs. Computer software programs such as SPSS will execute the tedious task of calculating Spearman’s rho very easily.
Correlations range from –1 to +1. At these extremes, the correlation between the two characteristics is perfect, although it is negative or inverse in the first instance. A perfect correlation is one where the two characteristics increase or decrease by the same amount. This is a linear relationship as illustrated below.
A correlation coefficient of 0 therefore refers to a situation where no relationship exists between the two characteristics. In other words, changes in one characteristic cannot be explained by the changes occurring in the second characteristic. A common way of interpreting the strength of a correlation is as follows:
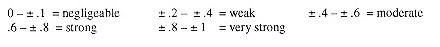
However, in most tourism and hospitality related research, corrections between ± .26 to ± .5 are generally considered to be quite high, with strong or very strong correlations rarely found.
The variation in one characteristic can be predicted if we know the value of correlation, since we can calculate the coefficient of determination or r2.
If we have a correlation of ±.5, then ±.52 = .25. We can therefore conclude that 25% of the variation in one characteristics can be predicted by the value of the second measure.
Let us take a look at an example to make these interpretations clearer. Let us assume we wish to determine whether pleasure travellers who are interested in staying in first class hotels are motivated because they wish to indulge in luxury or because of some other motivation, such as the identification of luxury hotels with big modern cities. By running a Spearman correlation on these three ordinal variables that asked respondents to rate the importance of each, we obtain the following output:
|
First class hotel |
Big modern cities |
Indulging in luxury |
|||
| Spearman's rho | First class hotel | Correlation Coefficient |
1.000 |
.229** |
.615** |
| Sig. (2-tailed) |
. |
.000 |
.000 |
||
| N |
1472 |
1467 |
1468 |
||
| Big modern cities | Correlation Coefficient |
.229** |
1.000 |
.246** |
|
| Sig. (2-tailed) |
.000 |
. |
.000 |
||
| N |
1467 |
1480 |
1476 |
||
| Indulging in luxury | Correlation Coefficient |
.615** |
.246** |
1.000 |
|
| Sig. (2-tailed) |
.000 |
.000 |
. |
||
| N |
1468 |
1476 |
1487 |
**Correlation is significant at the .01 level (2-tailed).
If we look at the first pair of variables (‘big modern cities’ by ‘first class hotel’) we note that the correlation coefficient is .229 or ‘weak’, while the statistical significance is very high (.000 is so small that the number itself is cut off) Indeed, as the footnote says, the results are significant at the .01 level. This can also be interpreted as "the level of confidence is 99%"(1 - .01 = .99). Finally, the output informs us that 1472 of our survey respondents answered both questions.
Similarly, the second pair of variables (‘indulging in luxury’ by ‘first class hotel’) show us a strong correlation (indeed, unusually high for this type of research at .615) that is statistically significant and where 1468 respondents answered both questions.
We can therefore conclude that ‘indulging in luxury’ is strongly correlated with the choice of first class hotel accommodation and that 38% (r2 = .615 x .615) of the variance in first class hotels is determined by this factor. Furthermore, this finding is statistically significant, which means we can reject the null hypothesis that there is no relationship between the importance attributed to staying in first class hotels and indulging in luxury. We can further conclude that while ‘big modern cities’ are associated with luxury hotels, that correlation is weak with only 5% (r2 = .229 x .229) of the variance in luxury hotels explained by it.
6. Implications, Conclusions and Recommendations
While your data analysis will need to analyze every questions asked, discussing such things as statistical significance and correlations, when you are ready to draw conclusions, you will have to determine what the main findings of your report really are. Not everything is worthy of being re-discussed when drawing conclusions. It is quite likely that the reader or readers of the final report have not spent much time thinking about the research, but want to understand quickly without having to read every last bit of analysis and data manipulation.
The final chapter of the research report must bring the research together and provide an interpretation of the results, written in language that is commonly understood even by managers who may not be well versed in statistical analysis, a summary of the critical conclusions of which management or any other specific audience needs to be aware, and strategic recommendations based on the findings of the research.
In more commercial reports the analysis of the data and the interpretation of the results may well go hand in hand, with only those findings directly relevant to the study objectives being discussed. Only summary tables and charts are part of the write-up. In these cases, the detailed analysis and a comprehensive set of tables and charts are usually confined to a technical report.
Interpreting Results
In the Data Analysis, the results for each question in the survey were discussed along with the appropriate statistical analysis and an illustration in the form of a table or chart. As part of the interpretation of the results, you need to go back to the findings previously discussed and interpret them in light of the subproblems you posed as part of your research question. This subproblem interpretation is based on the results of each research item. Whereas in the data analysis you only identify the results without editorializing or commenting on them, now we are ready to draw conclusions about the data.
As part of the interpretation, you will want to place your results in the context of your literature review. That is to say, to what extent do you have an explanation why other researchers might have reached different conclusions, or even what the implications are of your data pointing to similar results. Since your literature review drove the development of your hypotheses, it is logical that you would discuss whether hypotheses tested positive or negative as part of your interpretation.
In more commercial research reports, the data analysis and their interpretation are usually presented together; in more academic reports they are separated into two chapters (four and five), with the first one discussing only the direct conclusions based on presentations of numbers, percentages and other hard data, and the second one interpreting the work presented in Chapter four. However, because they are so closely related, it is a good idea to prepare and write these two chapters in parallel, even for academic reports.
Summarizing Conclusions
Summarizing conclusions is a two-step process, whereby
- you review the conclusions of all the hypotheses, and from these conclusions
- you draw overall conclusions for the research question itself.
These conclusions are usually listed numerically, and then further discussed one by one. The reasoning followed to reach the conclusions and the data that supports the statements made are incorporated into a brief editorial comment with respect to the global interpretation.
It is absolutely critical at this point not to cede to temptation to make concluding statements that would apply the study’s results beyond the parameters established for the study under the problem definition. Indeed, you may even want to incorporate a statement warning the reader not to interpret the results in such a way that generalizations beyond the study’s parameters are made.
You may, however, want to address how a potentially valid generalization could be made in your Recommendations section.
Making Recommendations
No matter how complete your study was, there will always be further research that will be required to shed more light on the research question, particularly if there is an interest in generalizing the findings beyond the study’s parameters. You will also have found areas within the literature itself that have considerable gaps that should be addressed, and to which your study may or not have contributed. Therefore, a summary section regarding recommendations for further study is appropriate.
If the research was undertaken on behalf of a client, then it is also important to provide the manager with a set of recommendations that directly address the management situation that led to the research being commissioned in the first place. However, as much as the manager may want far reaching recommendations, care has to be exercised that they are indeed anchored in the findings of the study and do not exceed its parameters.
Glossary
Applied research
answers specific questions about specific problems or makes decisions about particular courses of action
Basic or pure research
advances the knowledge about a given concept or tests the acceptability of a given theory
Basic research
(also called pure research) advances the knowledge about a given concept or tests the acceptability of a given theory
Bell curve
(also called normal curve) a symmetrical distribution that describes the expected probability distribution of many samples or chance occurrences
Bias
anything that influences unduly the outcome of research results
Case study
an intensive investigation of specific situation that can provide insight to the problem at hand
Causal research
research that attempts to show that there is a cause and effect relationship between certain variables
Central tendency
or "average"; there are three types: mode, median and mean
Chi-square
determines whether differences between groups are statistically significant
Close-ended question
respondents is limited to a number of given alternatives in his/her response
Cluster sampling
the random selection of groups of units rather than individual units from the population
Conclusive research
research that has followed a formal research design process and provides reliable information on which to base decisions
Content validity
(also called face validity) determines whether the research instrument measures what it is supposed to measure
Convenience sampling
the selection of units from the population based on easy availability and/or accessibility
Correlation
determines the relationship between two variables, and to what degree one variable will vary as a result of the other
Criterion validity
said of a research instrument that tests whether there is consistency in the way a respondent answered
Criterion variable
(also called dependent variable) a variable that can be explained or predicted since they are the effect of the independent variable; the variable that is expected to change because of the manipulation of another (independent) variable
Delimitations
restrictions that have been placed on the study in order to make it more doable, e.g. surveying adults aged 18 and over only
Dependent or criterion variable
a variable that can be explained or predicted since they are the effect of the independent variable; the variable that is expected to change because of the manipulation of another (independent) variable
Dependent variable
(also called criterion variable) a variable that can be explained or predicted since they are the effect of the independent variable; the variable that is expected to change because of the manipulation of another (independent) variable
Descriptive research
(also called statistical ) research designed to describe the characteristics of the population or universe under study
Experimentation
research that allows for the isolation of one variable at a time while the others are being kept constant to test a hypothesis about cause and effect
Exploratory research
initial research conducted to determine the real scope of the problem and the course of action to be taken, including whether further research is required
External validity
said of research where the results apply to other similar approaches in the "real" world
Face or content validity
determines whether the research instrument measures what it is supposed to measure
Face validity
(also called content validity) determines whether the research instrument measures what it is supposed to measure
Focus group
an unstructured, free-flowing but moderated interview with a small number of selected individuals on a specific topic
Frequency
the number of times a given response occurs, expressed in absolute numbers or in percentage
Heterogeneity, heterogeneous
dissimilarity, made up of unlike elements or parts
Homogeneity, homogeneous
similarity, made up of like elements or parts
Hypothesis
(pl. hypotheses) educated guess as to the outcome of the research
Independent variable
(also called predictor variable) a variable that is thought to be independent of the outcome itself but instead influence other variables; the variable that is manipulated in experimental research
Intercept survey
respondents are approached in a high traffic area (e.g. a mall) and asked to complete a questionnaire either as part of an interview or self-administered
Internal validity
said of research where it can be shown that the observed changes in the data were the exclusive result of the experiment
Interval scale
not only orders items but also measures the exact difference between points
Interviewer error
(or bias) occurs when the interviewer's behaviour, appearance or actions in some way influence the respondents such that s/he will provide an inaccurate answer
Item non-response
refers to the failure to provide an answer to a question and is particularly common with open-ended questions
Judgement sampling
the researcher or some other "expert" uses his/her judgement in selecting the units from the population for study based on the population's parameters
Marketing research
systematic and objective gathering and analysis of information in support of marketing decisions
Mean
one of the measures of central tendency, also referred to as the arithmetic average; calculated by adding up the values for each case and dividing by the total number of cases
Median
one of the measure of central tendency, also known as the midpoint or the value below which half the values in a distribution fall
Mode
one of the measure of central tendency, also known as the value that occurs most often
Nominal scale
numbers or letters assigned to the item that serve to label it for identification or classification into mutually exclusive categories
Non-probability sampling
selection of the sample in such a way that each unit within the population or universe is not chosen by chance; three types are judgement, quota and convenience sampling
Non-response error
(or bias) occurs when the respondents who did not participate in the study for a variety of reasons are in fact different from those who did
Normal curve
(also called bell curve) a symmetrical distribution that describes the expected probability distribution of many samples or chance occurrences
Normal or bell curve
a symmetrical distribution that describes the expected probability distribution of many samples or chance occurrences
Observation technique
the systematic recording of behaviour patterns of the subjects or occurrences without questioning or in any way communicating with them
Open-ended question
there are no pre-determined answers to choose from; the respondent uses his/her own words to answer the question
Ordinal scale
permits the measurement of a degree of difference (more or less), but does not indicate the how much more or less of a particular characteristic an object has; also referred to as rank-order scale
Parameter
the population (as opposed to the sample) value of a distribution
Pilot study
the collection of data from a limited number of the ultimate consumer group targeted or the actual subjects of the research project
Population
(also called universe) all elements within a given group, whether people, objects or organizations, about whom information is required; normally expressed as "N"
Population or universe
all elements within a given group, whether people, objects or organizations, about whom information is required; normally expressed as "N"
Population parameter
the variable or characteristic of population that are being measured
Predictor variable
a variable that is thought to be independent of the outcome itself but instead influence other variables; the variable that is manipulated in experimental research
Pretest
a trial run of the questionnaire; administering a questionnaire to a small group of respondents to determine whether there are any potential problems with question wording and layout that could introduce bias
Primary research
information gathered specifically for the project at hand, whether using quantitative or qualitative research techniques Predictor variable (also called independent variable) a variable that is thought to be independent of the outcome itself but instead influence other variables; the variable that is manipulated in experimental research
Probability sampling
selection of the sample in such a way that each unit within the population or universe has a known chance of being selected; three types are simple, stratified and cluster random sampling
Pure Research
(also called basic research) advances the knowledge about a given concept or tests the acceptability of a given theory
Qualitative research
in-depth research into the motivation, attitudes and behaviour of respondents or into a given situation
Quantitative research
information in the form of numbers that can be quantified and summarized
Quota sampling
selection of units from the population that has been segmented into mutually exclusive sub-groups based on a specified proportion of sample units from each segment
Random sampling
each unit to be selected from the population has a known and equal chance of being selected
Randomization
procedure whereby the selection of subjects is based on chance
Range
the distance between the smallest and largest values of a frequency distribution
Ratio scale
numbers on the scale not only represent equal distances from one another, but there is also an absolute zero point
Reliability
the extent to which results are consistent over time and an accurate representation of the total population under study
Repeatability
(also called replicability) the ability to replicate or repeat a study to determine whether the same results can be obtained; a measure of reliability
Replicability
(also called repeatability) the ability to replicate or repeat a study to determine whether the same results can be obtained; a measure of reliability
Replicability or repeatability
the ability to replicate or repeat a study to determine whether the same results can be obtained; a measure of reliability
Representative
said of a sample that has been chosen randomly from the population, where it can be viewed as an approximation of that population
Request for Proposal
(RFP) a research buyers’ statement outlining his/her research needs issued to potential suppliers and calling for a proposed methodology and price quotation in response to the research problem described
Research design
The plan used to guide the researcher in choosing the methods and procedures for collecting, analyzing and interpreting data
Research instrument
a measuring form or data collection device, such as a questionnaire
Response error
(or bias) occurs when the respondent consciously or unconsciously provides an untruthful answer
Response error or bias
occurs when the respondent consciously or unconsciously provides an untruthful answer
Response rate
the proportion of respondents that participated in the study; the number of respondents that participated/completed a survey divided by the total number of subjects contacted or requested to participate in the study x 100 (expressed as %)
Sample
a proportion of the population; a sub-set of a larger group; normally expressed as "n"
Sample bias
occurs when the sample deviates from the true value of the population
Sample statistics
the variables or characteristics of the sample that are being measured and from which inferences are made about the population parameters
Sampling frame
(also called working population) The list of elements or physical entity from which the sample is drawn, e.g. a telephone directory or membership listing
Sampling frame error
occurs when the sampling frame does not accurately reflect the operational definition of the population or certain sample elements are not listed
Sampling frame or working population
The list of elements or physical entity from which the sample is drawn, e.g. a telephone directory or membership listing
Sampling unit
the element or group of elements targeted for selection in the sample
Scale
a set or range of numbers or scores which allows for the measurement of a particular concept or attribute
Scientific method
a systematic approach to gathering information that will lead to the unbiased assessment of whether an expected outcome is confirmed or disproved; generally follows six distinct steps: formulation of the problem; determination of sources of information; determination of research and sample design; collection of the data; analysis and interpretation of the data
Secondary data
Any information that has been previously collected or published. It includes literature as well as data assembled other projects
Secondary research
Any information that has been previously collected or published. It includes literature as well as data assembled other projects
Simple random sampling
a sampling procedure whereby each element in the population has an equal chance of being selected
Simulation
a computer model is used to recreate a certain real-life situation and determine mathematically what the results would be if a certain variable is changed in the cause and effect equation
Standard deviation
a measure of how widely scores are spread out or dispersed
Statistical significance
indicates a result that happens by chance, usually less then once in 20 times (.05)
Stratified sampling
segmenting a population into mutually exclusive subgroups or strata and then randomly selected units from each stratum
Survey technique
a method whereby primary data is collected about subjects, usually by selecting a representative sample of the population or universe under study, through the use of a questionnaire
Universe
(also called population) all elements within a given group, whether people, objects or organizations, about whom information is required; normally expressed as "N"
Validity
the ability of research to measure that which it was intended to measure; the truthfulness of the research
Variable
any criteria or factor that can be expressed numerically; any property that can take on different values
Weighting
increasing or decreasing the weight attributed to a part of the sample to make it proportionate to the characteristic found in the population Working population (also called sampling frame) The list of elements or physical entity from which the sample is drawn, e.g. a telephone directory or membership listing