Calculating the Chi-Square
The chi-square (pronounced ‘kai’) distribution is the most commonly used method of comparing proportions. Its symbolized by the Greek letter chi or χ2). This test makes it possible to determine whether the difference exists between two groups and their preference or likelihood of doing something is real or just a chance occurrence. In other words, it determines whether a relationship or association exists between being in one of the two groups and the behaviour or characteristic under study. If in a survey of 692 respondents we asked whether or not they are interested attending attractions and events that deal with history and heritage during their vacation, and we wanted to determine whether there is a difference in how men and women respond to this question, we could calculate a chi-square.
χ2 determines the differences between the observed (fo) and expected frequencies (fe). The observed frequencies are the actual survey results, whereas the expected frequencies refer to the hypothetical distribution based on the overall proportions between the two characteristics if the two groups are alike. For example, if we have the following survey results:
| Observed frequencies | |||
| History & Heritage | Men | Women | Total |
| Yes | 95 | 159 | 254 |
| No | 199 | 239 | 438 |
| Total | 294 | 398 | 692 |
Then we can calculate our expected frequencies (fe) based on the proportion of respondents who said ‘yes’ versus ‘no’. It can also be calculated for each cell by the row total with the column total divided by the grand total (e.g. 254 x 294 : 692 = 108).
| Expected frequencies | |||
| History & Heritage | Men | Women | Total |
| Yes | 108 | 146 | 254 |
| No | 186 | 252 | 438 |
| Total | 294 | 398 | 692 |
This second table, where no relationship exists between the interest in attending history and heritage attractions and events and gender, also represents the null hypothesis or Ho. (Therefore, if a study says that it "fails to reject the null hypothesis", it means that no relationship was found to exist between the variables under study.)

Hence, the calculation is as follows:
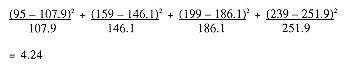
The critical value for a level of significance of .05 (or 95% level of confidence, the normal level in this type of research) is 3.841. This means that you are confident that 95% of the distribution falls below this critical value. Since our result is above this value, we can:
- Reject the null hypothesis that no difference exists between interest in attending historical attractions and events and gender (in other words, there is a difference between genders); and
- Conclude that the differences in the groups are statistically significant (or not due to chance)
You will not need to memorize all the critical values since computer programs such as SPSS will not only calculate the χ2 values for you, but will also give you the precise level of observed significance (known as p value), which in our case is .039. If this level of significance is above the standard .05 level of statistical significance, you are dealing with a statistically significant relationship.