June 30, 2015 Pension Quarterly Investment Report
Performance Review
University of Guelph Pension Plans
2ndQuarter 2015
Prepared by:
Pavilion Advisory Group Ltd.
1250 René-Lévesque Blvd. West, Suite 4030
Montreal, Quebec
H3B 4W8 Canada
Pension Plans Results Overview
(Gross Returns for the 12 months ended June 30th, 2015)
The Total Plan returned 7.6% for the last 12 months, an underperformance of 1.7% versus its composite benchmark.
| Canadian Equity | U.S. Equity |
|---|---|
|
|
| Global/Non-North American Equity | Fixed Income |
|
|
Total Pension Portfolio Vs Composite Benchmark
As of June 30, 2015 (Gross of Fees, Annualized for Periods over 1 year)
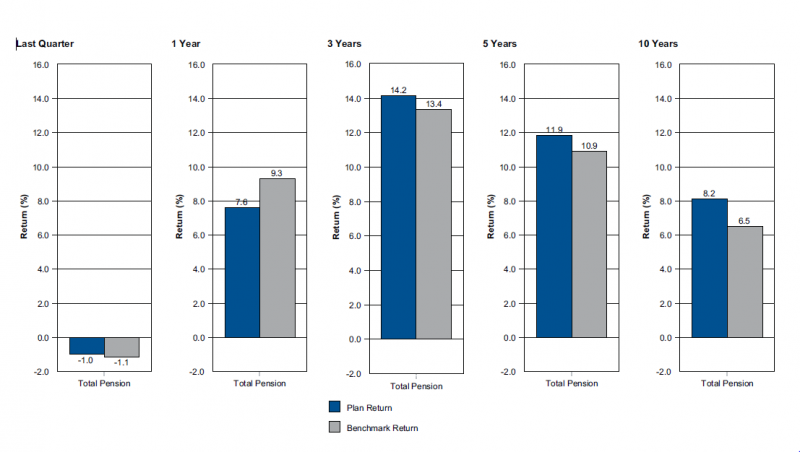
Returns are presented gross of fees in CAD
Current Composite Benchmark: 25% S&P/TSX Comp Capped + 20% MSCI EAFE ($CAD) + 20% S&P 500 ($CAD) + 28% FTSE TMX Universe + 2% FTSE TMX 91 Day T-Bill + 5% IPD Canada Annual Property index.
Annualized Asset Class Performance
As of June 30, 2015 (Gross of Fees)
| Allocation | Performance(%) | ||||||||||||
|---|---|---|---|---|---|---|---|---|---|---|---|---|---|
| Market Value ($) | % of Portfolio | Year to Date | 1 Year | 2 Years | 3 Years | 4 Years | 5 Years | 6 Years | 7 Years | 8 Years | 9 Years | 10 Years | |
| Canadian Equity | 309,509,858 | 23.4 | 1.9 | -0.5 | 14.0 | 14.6 | 8.4 | 10.7 | 10.8 | 51 | 5.1 | 7.7 | 8.6 |
| S&P/TSX Composite Index | 0.9 | -1.2 | 12.8 | 11.1 | 5.3 | 8.3 | 8.9 | 3.1 | 3.5 | 5.5 | 6.9 | ||
| Relative Performance | 1.0 | 0.7 | 1.2 | 3.5 | 3.1 | 2.4 | 1.9 | 2.0 | 1.6 | 2.2 | 1.7 | ||
| US Equity | 232,042,856 | 17.5 | 10.0 | 28.2 | 26.9 | 28.2 | 22.4 | 22.3 | 20.1 | 15.0 | 10.0 | 10.0 | 9.1 |
| S&P 500 | 9.1 | 25.9 | 25.9 | 25.5 | 21.8 | 21.2 | 18.3 | 12.7 | 8.5 | 9.2 | 8.1 | ||
| Relative Performance | 0.9 | 2.3 | 1.0 | 2.7 | 0.6 | 1.1 | 1.8 | 2.3 | 1.5 | 0.8 | 1.0 | ||
| Non-North American Equity | 228,636,295 | 17.2 | 12.4 | 10.4 | 18.5 | 20.5 | 14.0 | 15.4 | 13.3 | 9.2 | 5.0 | 7.1 | 7.2 |
| MSCI EAFE Index | 14.1 | 12.7 | 18.8 | 20.3 | 12.3 | 13.7 | 10.7 | 5.5 | 2.8 | 4.8 | 5.8 | ||
| Relative Performance | -1.7 | -2.3 | -0.3 | 0.2 | 1.7 | 1.7 | 2.6 | 3.7 | 2.2 | 2.3 | 1.4 | ||
| Global Equity | 114,841,966 | 8.7 | 11.5 | 20.8 | 24.0 | 24.4 | 18.8 | 19.9 | 16.4 | 8.7 | 4.9 | 6.9 | 7.3 |
| MSCI World Ex Canada | 11.4 | 20.4 | 23.1 | 23.4 | 17.6 | 17.9 | 14.9 | 9.4 | 6.0 | 7.3 | 7.2 | ||
| Relative Performance | 0.1 | 0.4 | 0.9 | 1.0 | 1.2 | 2.0 | 1.5 | -0.7 | -1.1 | -0.4 | 0.1 | ||
| Canadian Fixed Income | 377,178,134 | 28.5 | 2.4 | 6.3 | 5.8 | 3.8 | 5.2 | 5.1 | 5.4 | 5.5 | 5.6 | 5.6 | 4.9 |
| FTSE TMX Universe Index | 2.4 | 6.3 | 5.8 | 3.8 | 5.2 | 5.1 | 5.4 | 5.6 | 5.8 | 5.6 | 5.0 | ||
| Relative Performance | 0.0 | 0.0 | 0.0 | 0.0 | 0.0 | 0.0 | 0.0 | -0.1 | -0.2 | 0.0 | -0.1 | ||
| Real Estate | 58,119,955 | 4.4 | 2.4 | 5.7 | 7.4 | N/A | N/A | N/A | N/A | N/A | N/A | N/A | N/A |
| IPD Canadian Property Index | 2.3 | 6.5 | 7.8 | 9.7 | 10.9 | 11.4 | 10.3 | 9.1 | 9.1 | 10.0 | 10.8 | ||
| Relative Performance | 0.1 | -0.8 | -0.4 | N/A | N/A | N/A | N/A | N/A | N/A | N/A | N/A | ||
| Internal Cash (STIF)* | 6,607,193 | 0.5 | 0.4 | 1.0 | 3.3 | 2.2 | 0.2 | 0.2 | 02 | 1.4 | 1.3 | 16.0 | 14.6 |
| FTSE TMX Canada 91 Day T-Bill - C$ | 0.4 | 0.9 | 0.9 | 0.9 | 1.0 | 0.9 | 0.8 | 1.0 | 1.4 | 1.7 | 1.8 | ||
| Relative Performance | 0.0 | 0.1 | 2.4 | 1.3 | -0.8 | -0.7 | -0.6 | 0.4 | -0.1 | 14.3 | 12.8 | ||
| Total Pension (Net of Fees) | 1,325,464,024 | 100.0 | 4.4 | 7.2 | 13.2 | 13.7 | 10.4 | 11.4 | 10.6 | 7.7 | 6.0 | 7.8 | 7.8 |
| Composite Benchmark | 5.7 | 9.3 | 14.3 | 13.4 | 9.9 | 10.9 | 10.1 | 6.4 | 5.3 | 6.4 | 6.5 | ||
| Relative Performance | -1.3 | -2.1 | -1.1 | 0.3 | 0.5 | 0.5 | 0.5 | 1.3 | 0.7 | 1.4 | 1.3 | ||
| Total Pension (Gross of Fees) | 1,325,464,024 | 100.0 | 4.6 | 7.6 | 13.7 | 14.2 | 10.9 | 11.9 | 11.1 | 8.1 | 6.4 | 8.2 | 8.2 |
| Composite Benchmark | 5.7 | 9.3 | 14.3 | 13.4 | 9.9 | 10.9 | 10.1 | 6.4 | 5.3 | 6.4 | 6.5 | ||
| Relative Performance | -1.1 | -1.7 | -0.6 | 0.8 | 1.0 | 1.0 | 1.0 | 1.7 | 1.1 | 1.8 | 1.7 | ||
| Total Pension ex.FX Overlay (Gross of Fees) | 1.326,936,257 | 100.1 | 5.9 | 9.5 | 15.0 | 15.2 | N/A | N/A | N/A | N/A | N/A | N/A | N/A |
| Composite Benchmark | 5.7 | 9.3 | 14.3 | 13.4 | 9.9 | 10.9 | 10.1 | 6.4 | 5.3 | 6.4 | 6.5 | ||
| Relative Performance | 0.2 | 0.2 | 0.7 | 1.8 | N/A | N/A | N/A | N/A | N/A | N/A | N/A | ||
| Effect of Passive Currency Hedge | -1.3 | -1.9 | -1.3 | -1.0 | N/A | N/A/ | N/A | N/A | N/A | N/A | N/A | ||
Current Composite Benchmark: 25% S&P/TSX Comp Capped + 20% MSCI EAFE ($CAD) + 20% S&P 500 ($CAD) + 28% FTSE TMX Universe + 2% FTSE TMX 91 Day-T-Bill + 5% IPD Canada Annual Property Index.
*Cash amounts and percentages presented exclude residual manager cash balances and FX overlay (currency hedging). However, they include the proceeds of the former Banyan Private Equity position, which explains its high 2-year return of 3.3%. All returns are reported gross of fees in CAD except for the Total Pension Plan where returns are displayed both net and gross of fees. EAFE stands for Europe, Australasia and Far East. The IPD Canadian Property Index is published quarterly with a 2-month lag, it is approximated by taking the previous quarter's return and converting it to a monthly basis (Index data from CIBC Mellon).
Annual Asset Class Performance
(Gross of Fees)
| Performance(%) | ||||||||||
|---|---|---|---|---|---|---|---|---|---|---|
| Jul 2014 to Jun 2015 | Jul 2013 to Jun 2014 | Jul 2012 to Jun 2013 | Jul 2011 to Jun 2012 | Jul 2010 to Jun 2011 | Jul 2009 to Jun 2010 | Jul 2008 to Jun 2009 | Jul 2007 to Jun 2008 | Jul 2006 to Jun 2007 | Jul 2005 to Jun 2006 | |
| Canadian Equity | -0.5 | 30.7 | 15.8 | -8.4 | 20.6 | 10.9 | -23.2 | 5.3 | 30.7 | 17.4 |
| S&P/TSX Composite Index | -1.2 | 28.7 | 7.9 | -10.3 | 20.9 | 12.0 | -25.7 | 6.7 | 22.7 | 19.6 |
| Relative Performance | 0.7 | 2.0 | 7.9 | 1.9 | -0.3 | -1.1 | 2.5 | -1.4 | 8.0 | -2.2 |
| US Equity | 28.2 | 25.5 | 30.9 | 6.7 | 21.6 | 10.0 | -11.4 | -19.4 | 9.9 | 1.7 |
| S&P 500 | 25.9 | 25.8 | 24.8 | 11.4 | 18.8 | 4.5 | -15.6 | -17.1 | 15.3 | -1.4 |
| Relative Performance | 2.3 | -0.3 | 6.1 | -4.7 | 2.8 | 5.5 | 4.2 | -2.3 | -5.4 | 3.1 |
| Non-North American Equity | 10.4 | 27.2 | 24.7 | -3.4 | 20.9 | 3.4 | -12.4 | -20.5 | 26.3 | 7.4 |
| MSCI EAFE Index | 12.7 | 25.3 | 23.3 | -8.5 | 19.1 | -2.8 | -21.0 | -14.2 | 22.0 | 15.3 |
| Relative Performance | -2.3 | 1.9 | 1.4 | 5.1 | 1.8 | 6.2 | 8.6 | -6.3 | 4.3 | -7.9 |
| Global Equity | 20.8 | 27.2 | 25.3 | 3.5 | 24.3 | 0.2 | -27.9 | -18.1 | 24.3 | 11.4 |
| MSCI World Ex Canada | 20.4 | 25.8 | 24.2 | 1.7 | 19.2 | 1.0 | -18.5 | -15.3 | 18.6 | 6.3 |
| Relative Performance | 0.4 | 1.4 | 1.1 | 1.8 | 5.1 | -0.8 | -9.4 | -2.8 | 5.7 | 5.1 |
| Canadian Fixed Income | 6.3 | 5.3 | 0.0 | 9.4 | 4.7 | 7.2 | 6.0 | 6.5 | 5.0 | -0.6 |
| FTSE TMX Universe Index | 6.3 | 5.3 | -0.2 | 9.5 | 4.7 | 6.9 | 7.0 | 6.8 | 4.8 | -0.7 |
| Relative Performance | 0.0 | 0.0 | 0.2 | -0.1 | 0.0 | 0.3 | -1.0 | -0.3 | 0.2 | 0.1 |
| Real Estate | 5.7 | 9.1 | N/A | N/A | N/A | N/A | N/A | N/A | N/A | N/A |
| IPD Canadian Property Index | 6.5 | 9.2 | 13.4 | 14.8 | 13.3 | 5.2 | 1.7 | 9.6 | 17.0 | 18.5 |
| Relative Performance | -0.8 | -0.1 | N/A | N/A | N/A | N/A | N/A | N/A | N/A | N/A |
| Internal Cash (STIF)* | 1.0 | 5.6 | 0.0 | -5.3 | 0.2 | 0.1 | 9.2 | 0.0 | 243.9 | 2.9 |
| FTSE TMX Canada 91 Day T-Bill-C$ | 0.9 | 1.0 | 1.0 | 1.0 | 0.9 | 0.3 | 2.0 | 4.1 | 4.3 | 3.2 |
| Relative Performance | 0.1 | 4.6 | -1.0 | -6.3 | -7.0 | -0.2 | 7.2 | -4.1 | 239.6 | -0.3 |
| Total Pension (Net of Fees) | 7.2 | 19.6 | 14.7 | 1.1 | 15.4 | 6.7 | -8.4 | -5.1 | 23.7 | 7.3 |
| Composite Benchmark | 9.3 | 19.5 | 11.6 | 0.1 | 15.2 | 6.1 | -13.3 | -2.4 | 15.6 | 7.9 |
| Relative Performance | -2.1 | 0.1 | 3.1 | 1.0 | 0.2 | 0.6 | 4.9 | -2.7 | 8.1 | -0.6 |
| Total Pension (Gross of Fees) | 7.6 | 20.1 | 15.2 | 1.6 | 15.9 | 7.1 | -8.1 | -4.8 | 24.0 | 7.6 |
| Composite Benchmark | 9.3 | 19.5 | 11.6 | 0.1 | 15.2 | 6.1 | -13.3 | -2.4 | 15.6 | 7.9 |
| Relative Performance | -1.7 | 0.6 | 3.6 | 1.5 | 0.7 | 1.0 | 5.2 | -2.4 | 8.4 | -0.3 |
| Total Pension ex. FX Overlay (Gross of Fees) | 9.5 | 20.8 | 15.5 | N/A | N/A | N/A | N/A | N/A | N/A | N/A |
| Composite Benchmark | 9.3 | 19.5 | 11.6 | 0.1 | 15.2 | 6.1 | -13.3 | -2.4 | 15.6 | 7.9 |
| Relative Performance | 0.2 | 1.3 | 3.9 | N/A | N/A | N/A | N/A | N/A | N/A | N/A |
Current Composite Benchmark: 25% S&P/TSX Comp Capped + 20% MSCI EAFE ($CAD) + 20% S&P 500 ($CAD) + 28% FTSE TMX Universe + 2% FTSE TMX 91 Day T-Bill + 5% IPD Canada Annual Property Index.
*All returns are reported gross of fees in CAD except for the Total Pension Plan where returns are displayed both net and gross of fees.
Cash amounts and percentages presented exclude residual manager cash balances and FX overlay (currency hedging). However, they include the proceeds of the former Banyan Private Equity position, which explains the high 2014 return of 6.3%. The 2006 cash return was caused by marking to market value a private equity position that was held at book value since inception.
EAFE stands for Europe, Australasia and Far East.
The IPD Canadian Property Index is published quarterly with a 2-month lag, it is approximated by taking the previous quarter's return and converting it to a monthly basis (Index data from CIBC Mellon).
Performance Attribution
Total Pension Plans Vs Attribution Benchmark
1 Year Ending June 30, 2015
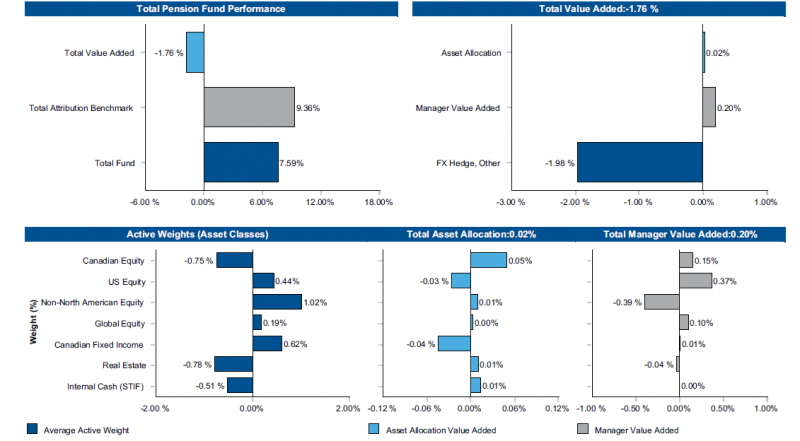
Returns are presented gross of fees in CAD
The Attribution Benchmark was created to account for small variations of asset allocation between the Total Pension Plans and their Composite Benchmark. Its composition is as follows: 25% S&P/TSX Comp Capped + 16% S&P 500 ($CAD) + 16% MSCI EAFE ($CAD) + 8% MSCI World + 28% FTSE TMX Universe + 5% IPD Canada Annual Property Index + 2% FTSE TMX 91 Day T-Bill.
The Benchmarks do not assume currency hedging.
“Other” includes the effects of all other factors on the Total Pensions Plans' relative return, including rebalancing and residual trading returns.
Pension Plans Asset Mix
Actual Allocation Vs Investment Policy Allocation
As of June 30, 2015
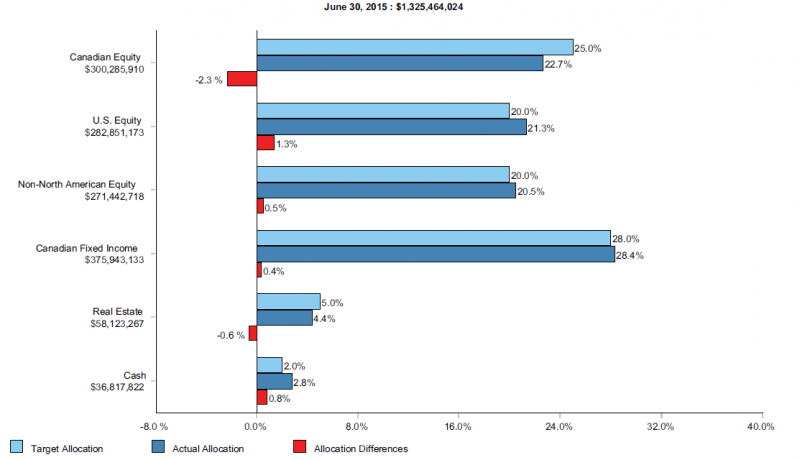
Note: this actual allocation displays the aggregate managers' holdings regardless of their mandate: Cash presented includes internal cash (STIF) and manager residual cash balances (data from CIBC Mellon). Real Estate includes Greystone Real Estate and a residual position in Banyan Private Equity ($3,239).
Pension Currency Exposure
As of June 30th, 2015
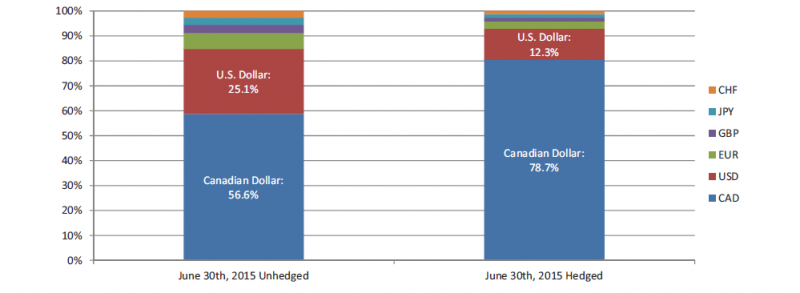
| Currency | June 30, 2015 Unhedged | Gross Exposure (CAD) | Hedge (CAD) | June 30, 2015 Hedged | Net Hedged Exposure (CAD) |
|---|---|---|---|---|---|
| Canadian Dollar | 56.6% | 750,940.505 | 291,903,670 | 78.7% | 1,042,844,175 |
| US Dollar | 25.1% | 333,268,294 | -170,705,183 | 12.3% | 162,563,111 |
| Euro | 6.0% | 80,099,491 | -43,064,127 | 2.8% | 37,035,363 |
| British Pound | 3.3% | 43,768,363 | -23,444,445 | 1.5% | 20,323,918 |
| Swiss Franc | 2.6% | 34,145,031 | -17,855,057 | 1.4% | 16,289,974 |
| Japanese Yen | 2.8% | 37,032,235 | -18,582,709 | 1.2% | 18,449,526 |
| Other | 3.6% | 47,753,195 | -19,724,380 | 2.1% | 28,028,815 |
Note: The Net Hedged Exposure equals the fund's original currency exposure to its total investments (Gross Exposure) plus the currency hedge implemented by Mesirow, which is designed to protect the pension fund from excessive foreign currency fluctuations.
Growth of Pension Assets
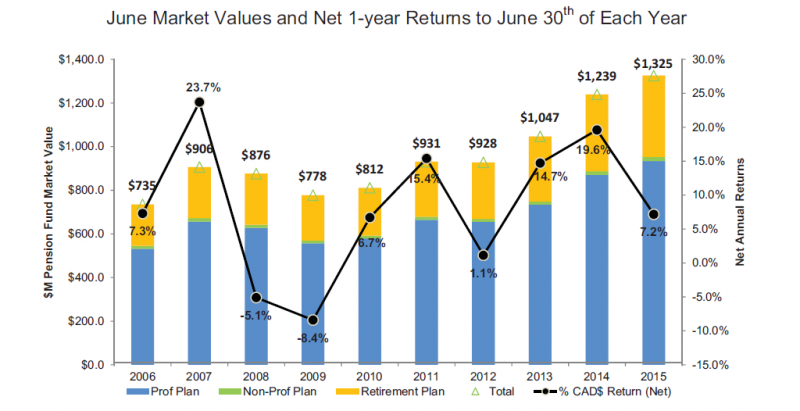
Over the last 12 months the total Pension portfolio increased $86 M to $1,325 M consisting of:
- -Total contributions of $65.2 M and distributions of $65.0 M
- - one year return (net of investment management fees) of 7.2% compared to 19.6% one year ago