Showing AI’s Work: A New Way to Track Machine Reasoning
Why AI Needs a Sanity Check
Artificial intelligence (AI) can classify images with impressive accuracy. But a correct answer does not always mean the model focused on the right parts of the image.
A model might correctly identify a bumblebee, but only because it focused on a fuzzy dandelion nearby rather than the bee itself. In fields such as medical imaging, autonomous driving and astronomy, where context is critical, that kind of shortcut matters.
Addressing this challenge is the goal behind explainable AI, a field focused on showing the evidence AI systems use to make decisions.
“If I am a doctor using this to check MRI images, I need some way to know whether the model’s decision makes sense,” said Dr. R. Ayesha Ali, statistics professor in the Department of Mathematics and Statistics at the University of Guelph (U of G), as well as director for its Master of Data Science program. “That was the sanity check we wanted to provide.”
Showing What AI Uses in an Image
While a U of G statistics graduate student, Aman Bhullar developed routing path visualization, or RPV, under Ali’s supervision. Michael Czomko, an undergraduate research assistant in U of G’s School of Computer Science, later performed extensive testing that compared RPV for capsule networks with common AI visualization methods for convolutional neural networks, including Grad-CAM, a popular AI technique. The work included collaborator Dr. Douglas L. Welch at McMaster University.
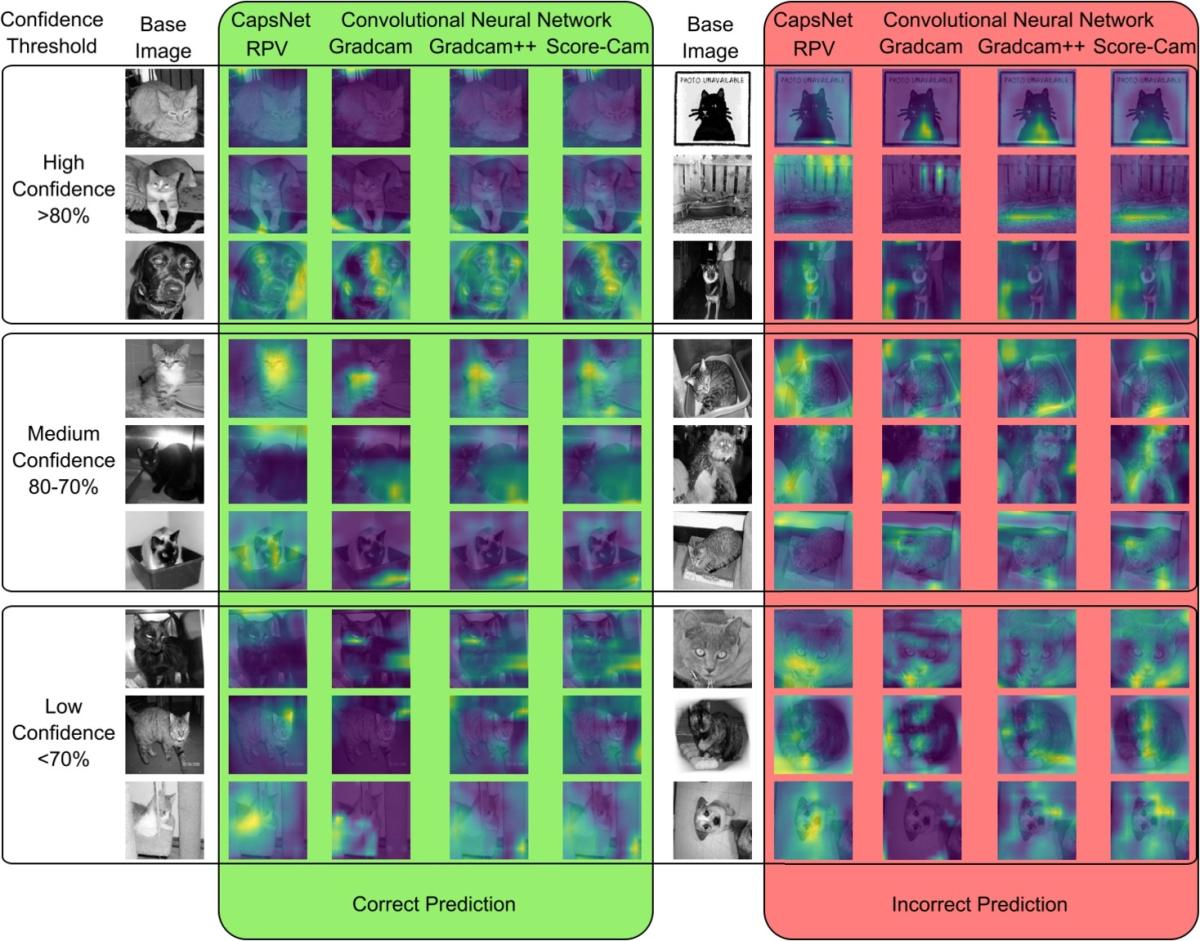
RPV is designed for capsule networks, a type of AI model that passes image information through small groups of artificial neurons called capsules. In a cat-dog image task, one final capsule can be trained to represent “dog” and another “cat.” RPV shows which parts of the image were routed toward the model’s predicted class, whether that is the animal’s nose, ears, body or something less useful, such as grass or the edge of the photo.
“The idea was to backtrack the route that information takes through the model,” said Bhullar. “If the model is making a prediction, RPV helps show what it was actually looking at.”
Finding Rare Signals in Space
The team tested RPV on astronomical images from the Canada-France-Hawaii Telescope. The goal was to detect supernova light echoes, rare signals formed when light from an exploded star reflects off interstellar dust.
These signals are difficult to find. Earlier work required thousands of images to be examined manually. With capsule networks, the team could search the images much faster. RPV then helped show whether the model worked as intended and focused on the light echo itself or on other bright features.
“The first time I tried it on a light echo image, I could see the light echo being highlighted,” said Bhullar. “It was not perfect at first, but it showed that the method was working.”
Seeing What the Model Is Using
Telescope images can include artifacts, which are image glitches caused by factors such as optics, cosmic rays or bright stars. Some artifacts can look similar to light echoes. RPV helped reveal when the model focused on the true signal and when it confused artifacts with light echoes.
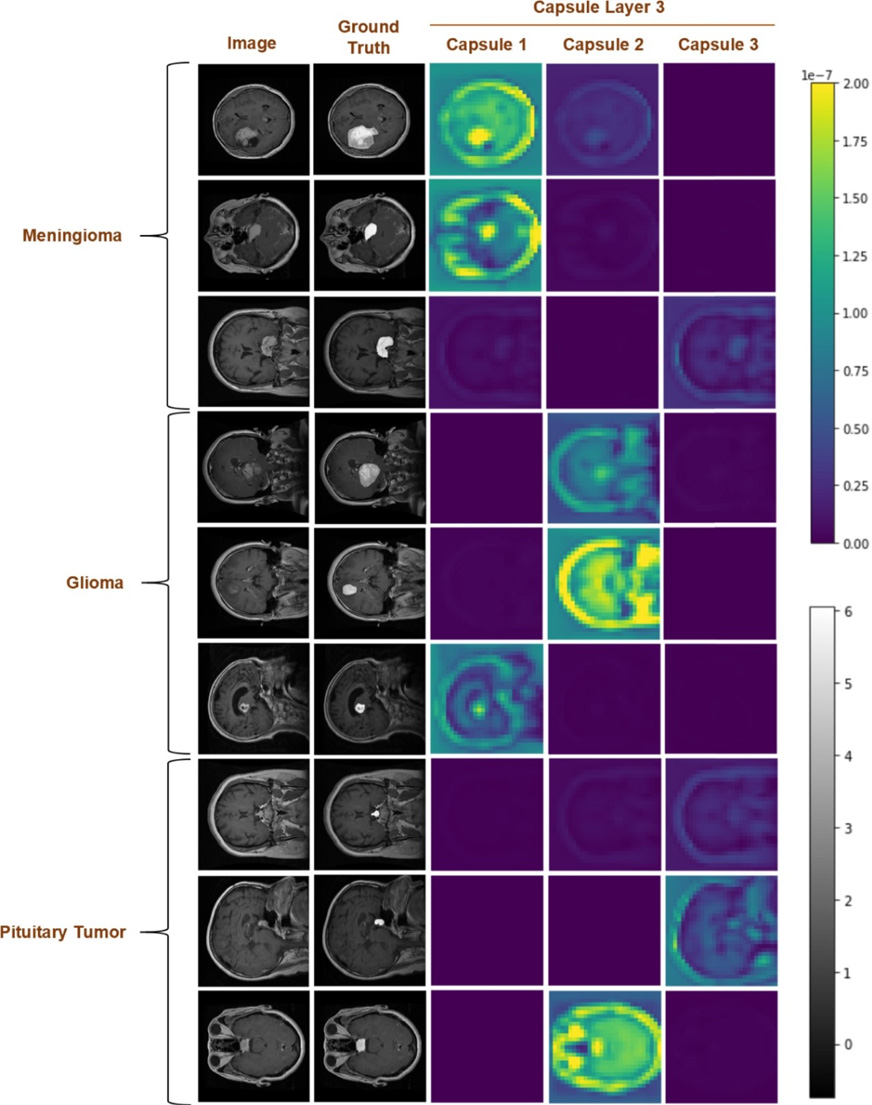
The researchers also tested RPV on brain MRI images. The visualization showed that the model sometimes focused not only on the tumour, but also on the skull outline or scan slice position. The image shows an RPV map for brain MRI images. The original MRI images and tumour locations are shown beside RPV maps for different tumour classes. Brighter regions show the image areas that influenced the model’s decision. The visualization helped reveal that the model sometimes used the skull outline or scan slice position, not only the tumour region, when classifying tumour type.
That finding matters because it suggests the model may have learned a shortcut from the dataset. Instead of learning only tumour features, it may have learned that certain tumour types often appeared in certain scan positions.
“The model was not necessarily learning the relationship we wanted it to learn,” said Ali. “RPV helps us see when the model is using evidence that may not match the real problem.”
Sometimes the visualization confirms that the model is using meaningful evidence. Other times, it reveals shortcuts, uncertainty or problems in the dataset.
Making AI More Trustworthy
RPV may be useful in areas where datasets are small and expert review is expensive or time-consuming. This includes medical imaging, astronomy, robotics and industrial quality control.
“RPV is very detailed,” said Czomko. “It can locate specific pixels or features, while some other visualization methods may only point to a general area.”
That precision could help researchers find model weaknesses earlier, improve training data and build AI tools that users can assess more confidently.
They recently presented this research at the AAAI Conference on Artificial Intelligence in Singapore, a leading international conference in the field.
Czomko continues to work with Ali on methods for assessing uncertainty in capsule-network predictions, an area where machine learning still faces important challenges. Bhullar, now a post-doctoral researcher with Agriculture and Agri-Food Canada, is also working with Ali on quantum machine learning for agricultural research.
Acknowledgement: This research was enabled in part by support provided by Compute Ontario (www.computeontario.ca) and Compute Canada (www.computecanada.ca). The images analyzed were based on observations obtained with MegaPrime/MegaCam, a joint project of CFHT and CEA/DAPNIA, at the Canada-France-Hawaii Telescope (CFHT) which is operated by the National Research Council (NRC) of Canada, the Institut National des Sciences de l’Univers of the Centre National de la Recherche Scientifique of France, and the University of Hawaii.
Reference: Bhullar A, Czomko M, Ali RA and Welch DL. Interpreting capsule networks for image classification by routing path visualization. Artificial Intelligence. 2025;104395. Elsevier.
This story was written by Mojtaba Safdari as part of the Science Communicators: Research @ CEPS initiative. Mojtaba is a PhD candidate in the School of Engineering under Dr. Amir A. Aliabadi.